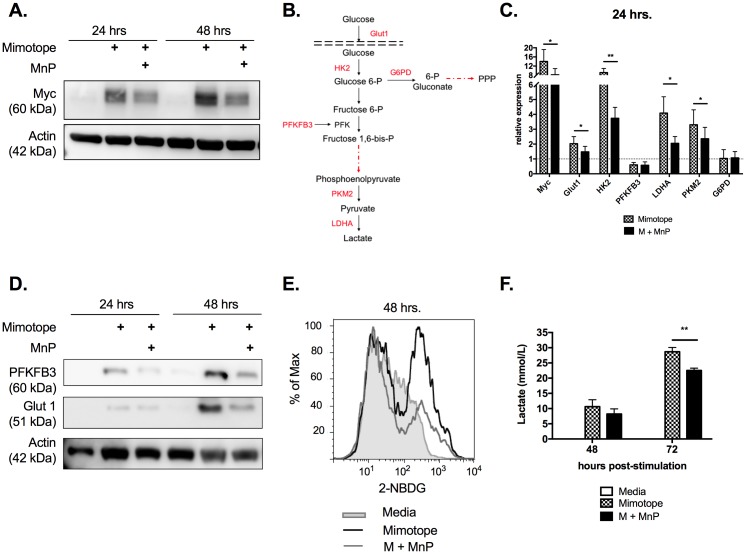
Fig 3. Transition to aerobic glycolysis during CD4+ T cell activation is dependent upon cellular redox status.
(a) Protein lysates were probed for Myc expression. β actin expression served as the loading control. (b) Glycolytic pathway with assayed Myc-dependent genes indicated in red. (c) 24 hours post-stimulation, mRNA expression of various glycolysis-associated genes was assessed by qRT-PCR. Relative values were normalized to unstimulated, naïve controls (Media). Data displayed are means of n = 5 independent experiments ± SEM. (d) Western blot analysis of specific Myc targets, PFKFB3 and Glut1. (e) 48 hours post-stimulation, cells were treated with 100 μM 2-NBDG and stained for CD4 following incubation. Glucose uptake was measured as 2-NBDG fluorescence of the CD4+ population. Histograms are representative of n = 8 experiments. (f) Lactate was measured in culture supernatants using the Accutrend Plus meter (Roche). Data are graphed as means of n = 5 experiments ± SEM. Statistical significance between mimotope and M + MnP groups was calculated using a Student’s t test (* = p<0.05, ** = p<0.01).

