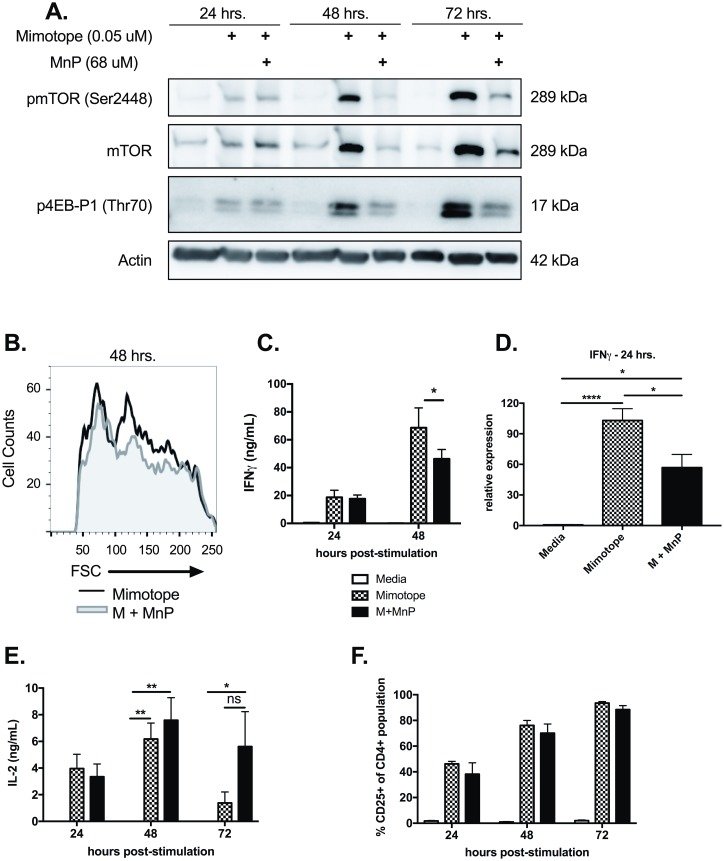
Fig 4. mTOR signaling is inhibited upon MnP treatment.
(a) Western blot analysis for phosphorylated mTOR (Ser4998; active), total mTOR, and the downstream mTOR target, phosphorylated 4E-BP1 (Thr70). β actin expression served as the loading control. (b) Forward scatter (FSC) of CD4+ T cells was measured by flow cytometry as an indication of cell blasting. Histogram is representative of n = 5 experiments. (c) IFNγ secretion was assessed by ELISA of culture supernatants. (d) Analysis of Ifnγ gene expression by qRT-PCR at 24 hours post-stimulation. (e) ELISA results measuring IL-2 secretion from culture supernatants. (e) Frequency of CD4+ T cells expressing CD25 following activation. Data displayed are combined means ± SEM of n = 6–9 experiments. Statistical significance was calculated using either a one-way or two-way ANOVA with Tukey or Bonferroni post-hoc analysis, respectively. (* = p<0.05). Media alone treated splenocytes served as negative controls.

