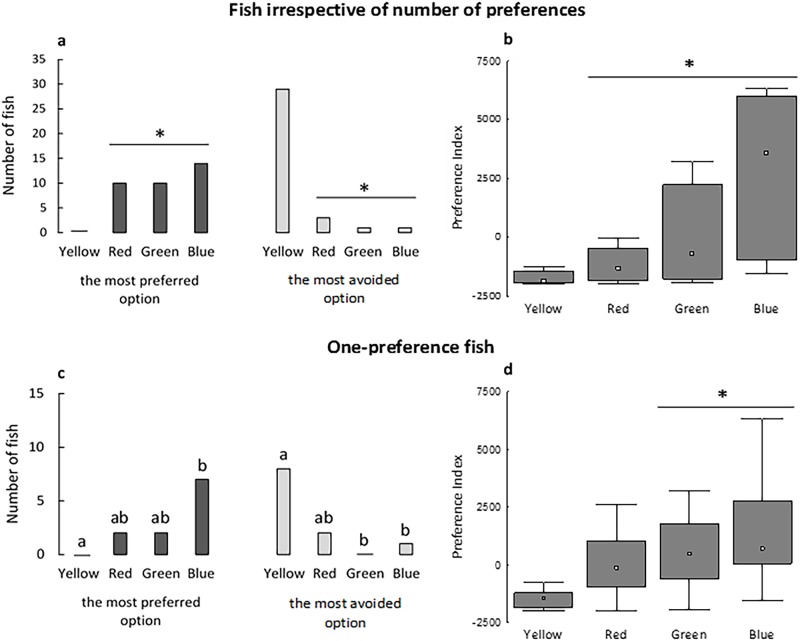
Fig 2. Background colors selected by fish as their most preferred or most avoided options, based on both the frequency of preference responses and the PI values for all tested fish (a and b, respectively) and for fish that preferred only one color (c and d, respectively).
In B and D, box-plot: □ indicates the median value; columns show the quartiles (Q1 and Q3) and bars indicate the maximum values. An asterisk (*) indicates a significant difference between colors in A (Goodman’s proportion test, P < 0.05), B (Friedman test, P < 0.0001, Fr = 37.06) and D (Friedman test, P < 0.007, Fr = 12.09). Numbers of fish with different lowercase letters are significantly different in C (Goodman’s proportion test, P < 0.05). N = 34 in A and C, n = 26 in B, n = 7 in D.

