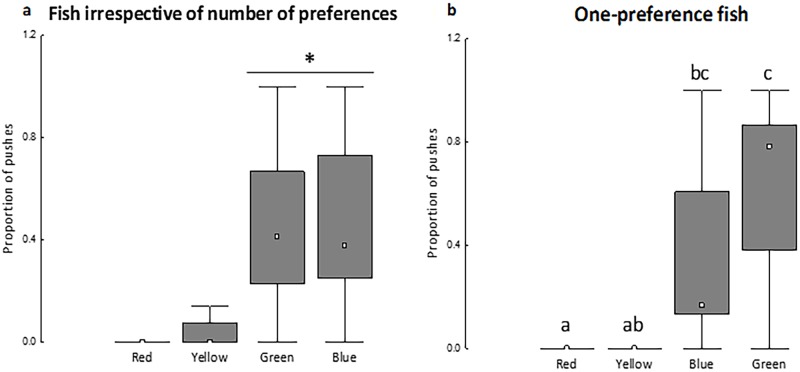
Fig 3. Proportion of touches on the transparent, hinged doors to each background color for all tested fish (a) and for fish that preferred only one color (b).
Box-plot: □ indicates the median value; columns show the quartiles (Q1 and Q3) and bars indicate the maximum values. In A, an asterisk (*) indicates a significant difference between colors (Friedman test, P < 0.0001, Fr = 61.47). In B, the proportion of touches with different lowercase letters are significantly different (Friedman test, P < 0.0003, Fr = 18.95). N = 33 in A, n = 10 in B.

