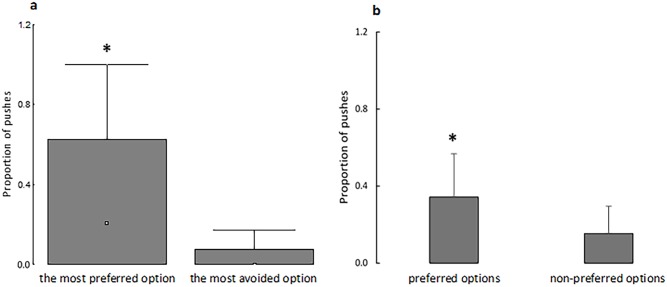
Fig 4. Proportion of touches made on the transparent, hinged doors to reach the individually most preferred and most avoided colors (a) or to access all of the individually preferred and non-preferred colors (b).
In A, box-plot: □ indicates the median value; columns show the quartiles (Q1 and Q3) and bars indicate the maximum value. In B (mean + SD), an asterisk (*) indicates a significant difference (Wilcoxon test, P = 0.002, Z = 3.03; dependent t-test, P = 0.003, t = 3.16). N = 33 in A and B.

