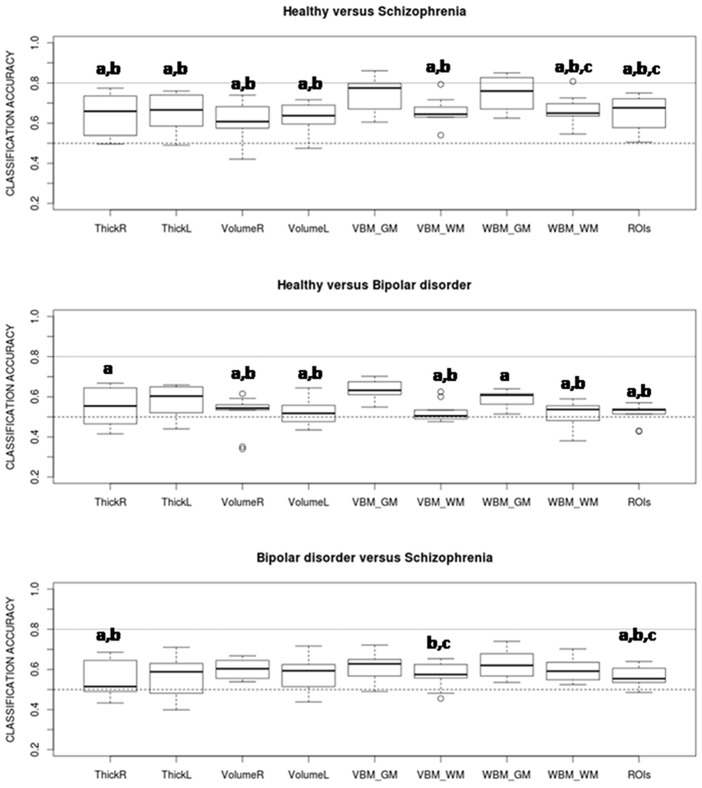
Fig 6. Accuracy rates averaged over all classifiers for the different feature types.
Pairs of features showing significant differences from paired Wilcoxon tests (with p < 0.05) are signaled. Most of the significant differences involve a higher accuracy rate for grey matter VBM and WBM. a: significantly different from VBM_GM, b: significantly different from WBM_GM, c: significantly different from VolumeR.

