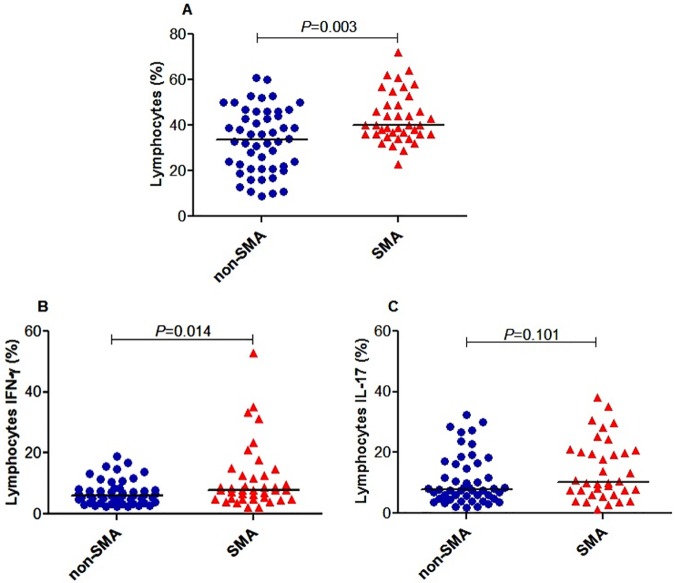
Fig 2. Lymphocytes expressing IFN-γ and IL-17 in acute malaria.
Data are presented as proportions (%). The proportions were determined by flow cytometry immediately after staining. The proportions of different lymphocyte populations were determined using FlowJo Software (TreeStar, Ashland, OR, USA). The line in the middle represents the median value. Between groups comparisons were performed by Mann-Whitney U test. (A) The proportion of lymphocytes was higher in the SMA group relative to non-SMA group. (B) The proportion of lymphocytes expressing IFN-γ was higher in the SMA group relative to non-SMA group. (C) The proportion of lymphocytes expressing IL-17 was higher in the SMA group relative to non-SMA group.

