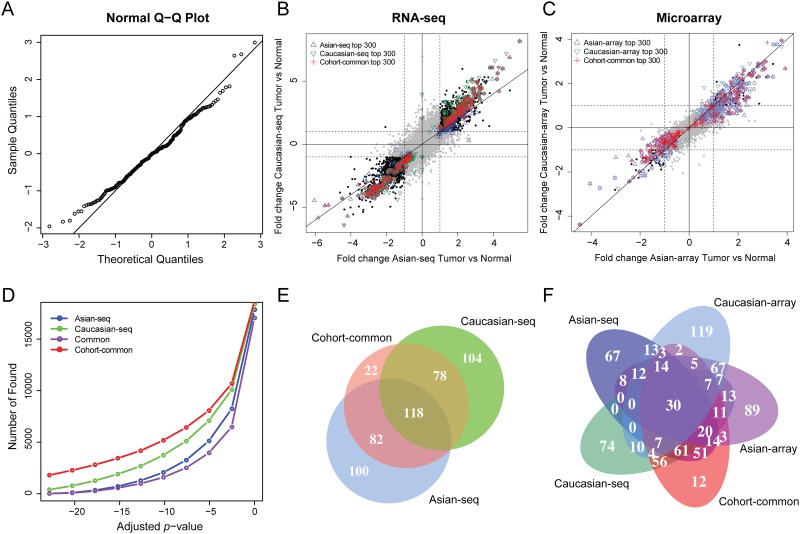
Fig 1. Cohort-common and cohort-specific detections of DEGs.
(A) Q-Q plot of residuals of one randomly selected gene from 4418 genes having significant differential tumor-normal log ratios of gene expression between populations. (B) Comparison of detections from Asian and Caucasian RNA-seq studies. (C) Comparison of detections from Asian and Caucasian microarray studies. (D) Comparison of discovery rates from population-common and population-specific analyses. (E) Venn diagram of the top 300 DEGs from Asian and Caucasian RNA-seq studies. (F) Venn diagram of the top 300 DEGs from all RNA-seq and microarray studies.

