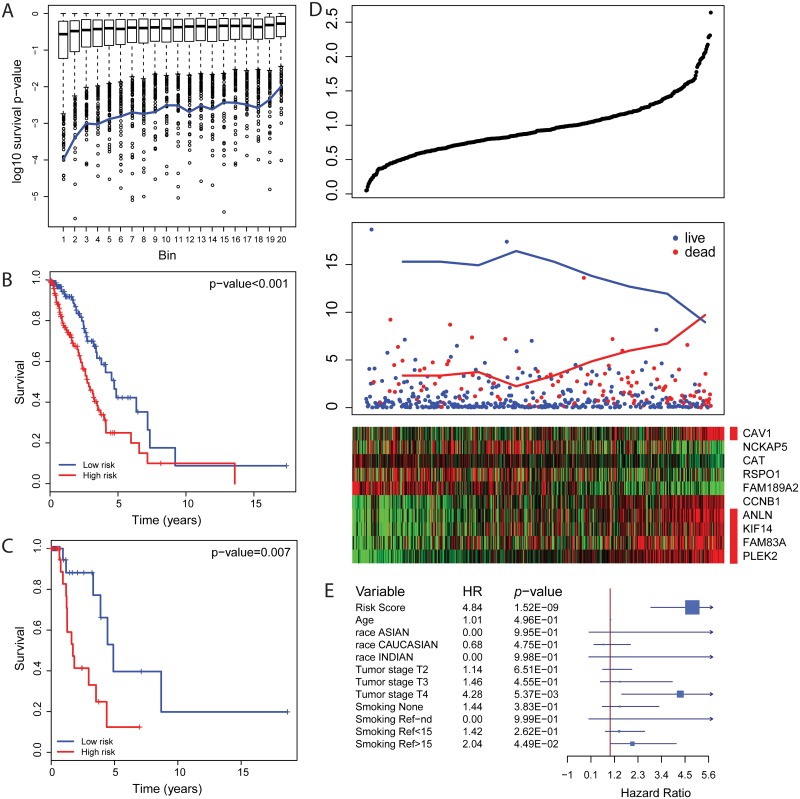
Fig 3. Prognosis markers.
(A) Tumor-normal DEGs have more power to predict survival outcome. Genes were ranked according to the significance of differential expression between tumor and normal tissues and were categorized into 20 bins evenly. The blue line indicates the rescaled discovery rate of survival associated genes. (B, C) Kaplan-Meier plot of high-risk and low-risk groups from training and test datasets. (D) From top to bottom, (panel 1) predicted risk scores; (panel 2) survival records of patients; (panel 3) gene expression of the 10 selected markers. Structural arrangement controlling genes are indicated by red bars. X axis in all 3 panels shows the patients in the same order. (E) Statistics of multiple regression with risk score and other clinical features as co-factors.

