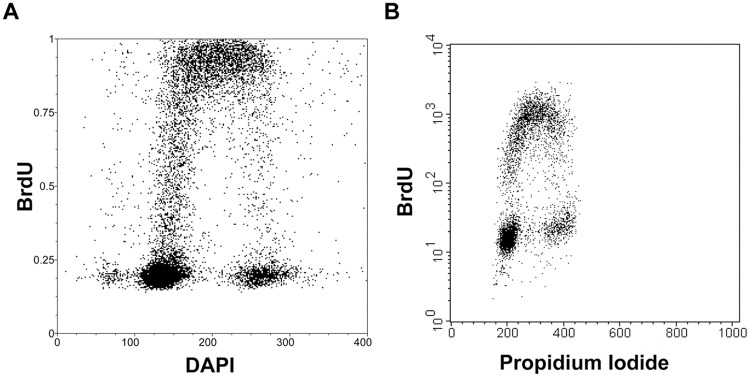
Fig 5. Determination of cell cycle by image and flow cytometry.
(A) The bivariate analysis of the replication signal and DNA content by DAPI in HeLa cells after a 30-minute incubation with 10 μM BrdU using image cytometry. (B) The bivariate analysis of the replication signal and DNA content by propidium iodide in A549 cells after a 30-minute incubation with 10 μM BrdU using flow cytometry.

