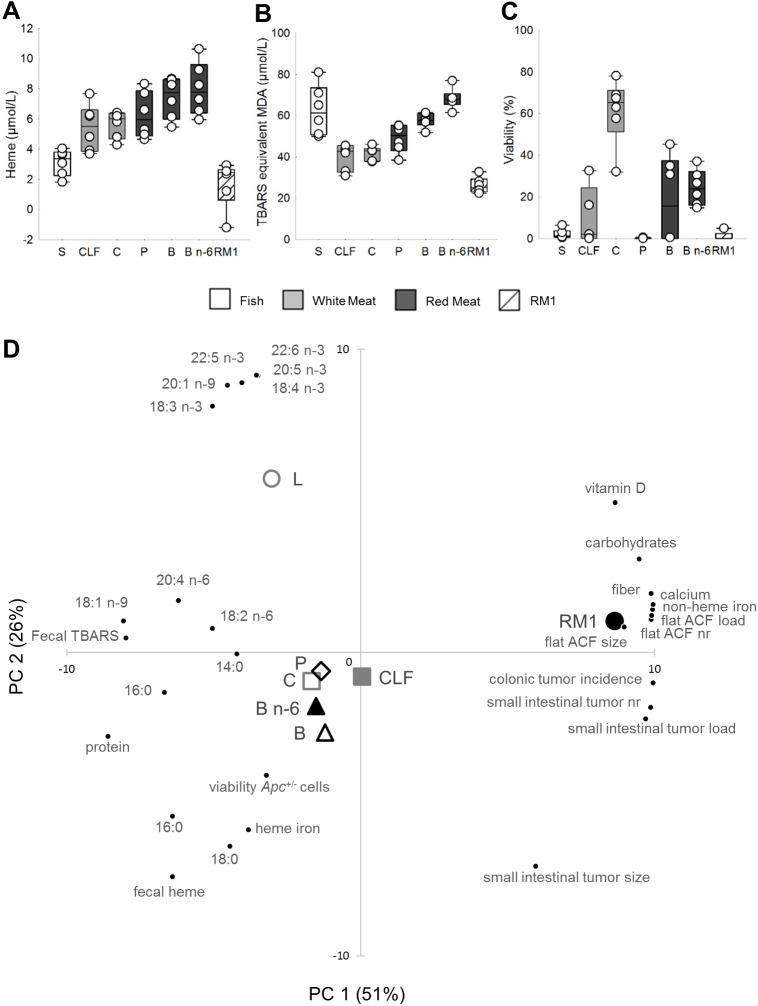
Fig 4. Fecal water analyses and scatter plot of PCA on experimental groups.
Fecal water content of (A) heme and (B) TBARS, and (C) cytotoxic effect of fecal water on Apc-/+ cells (n = 1, fecal water from pooled fresh feces of 18 to 19 animals per group). Data points and box plots indicate measurement uncertainties of the methods. (D) PCA biplot showing scores from PC1 and PC2: associations between experimental groups, and parameters of intestinal carcinogenesis and fecal water, and constituents of the experimental diets. Salmon [S], Chicken Low Fat [CLF], Chicken [C], Pork [P], Beef [B], Beef n-6 [B n-6].

