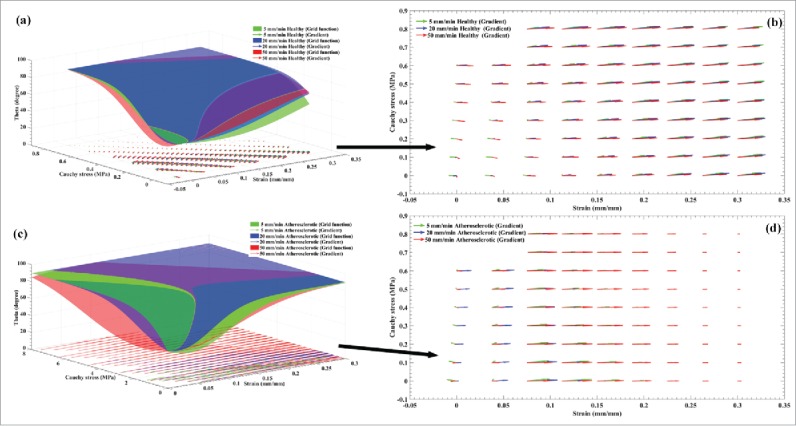
Figure 5.

Representation of (A) the ANNs grid function and the gradient of the collagen fibers during the application loading for the healthy coronary arteries at the strain rates of 5, 20, and 50 mm/min. In order to clearly show the distribution of the gradient of the collagen fibers for the healthy arteries at 3 different strain rates, (B) their distributions are magnified and presented. Similarly, (C) the ANNs grid function and the gradient of the collagen fibers during the application loading for the atherosclerotic coronary arteries at the strain rates of 5, 20, and 50 mm/min. In order to clearly show the distribution of the gradient of the collagen fibers for the atherosclerotic arteries at 3 different strain rates, (D) their distributions are presented.
