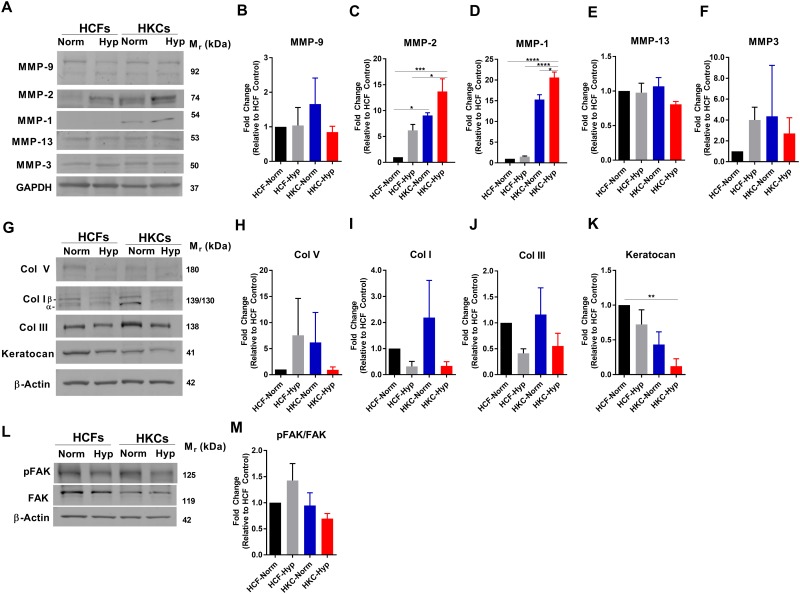
Fig 3. Effects of hypoxia on MMP, collagen expression, and FAK signaling in HCFs and HKCs under normoxic or hypoxic (2% O2) conditions.
(A) Representative western blots and (B-F) quantification for MMP-9, MMP-2, MMP-1, MMP-13, and MMP-3 expression. (G) Representative western blots of cytosolic collagen and keratocan expression and quantification of (H-K) Collagens I, III, V, and keratocan expression. (L) Representative western blot of pFAK and FAK expression and (M) quantification of the ratio of pFAK/FAK. Quantification determined using densitometry. n = 3, statistical significance determined by an ANOVA with * = p≤0.05, ** = p≤0.01, *** = p≤0.001, and **** = p≤0.0001.

