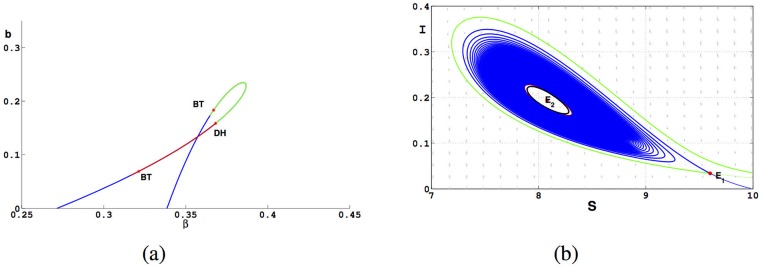
Fig 5. Graphs of Bifurcation curve in parameters plane (β, b) and the phase trajectory for system (5).
(a) Curve q(β, b) = 0. The green curve is supercritical Hopf bifurcation; The red curve is subcritical Hopf bifurcation. σ1 becomes 0 at the DH point. (b) Two limit cycles bifurcation from the weak focus E2.

