Figure 1.
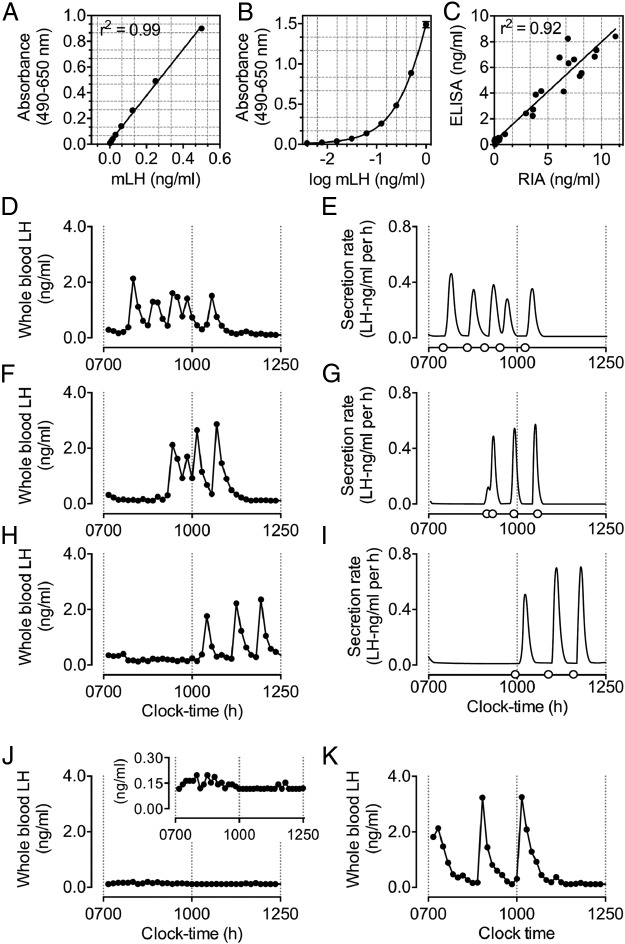
Validation of a sensitive method for the detection of pulsatile LH release in mice. A and B, Linear (A) and nonlinear (B) regression curves generated from mLH standards ranging from 0.0039 to 0.5 and from 0.0039 to 1 ng/mL, respectively (n = 32/curve). C, Direct comparison of the ELISA with a commercial RIA. D–I, Representative examples of measures of pulsatile LH secretion in male C57BL/6 mice at 10 weeks of age. Panels D, F, and H illustrate circulating levels of whole blood LH over a 6-hour sampling period. Starting at 7:00 am, whole blood samples were collected at 10-minute intervals. Panels on the right illustrate the secretion rate of LH after deconvolution analysis, with open circles on the x-axis indicating the onset of a pulse in LH secretion, as determined by deconvolution analysis (E, G, and I). Output parameters are summarized in Table 2. Representative example of measures of pulsatile LH secretion in a 32-week-old Gpr54 knockout (J) and an age-matched wild-type littermate control mouse (K). For all measures of pulsatile LH secretion, whole blood samples were collected at 10-minute intervals, starting at 7:00 am.

