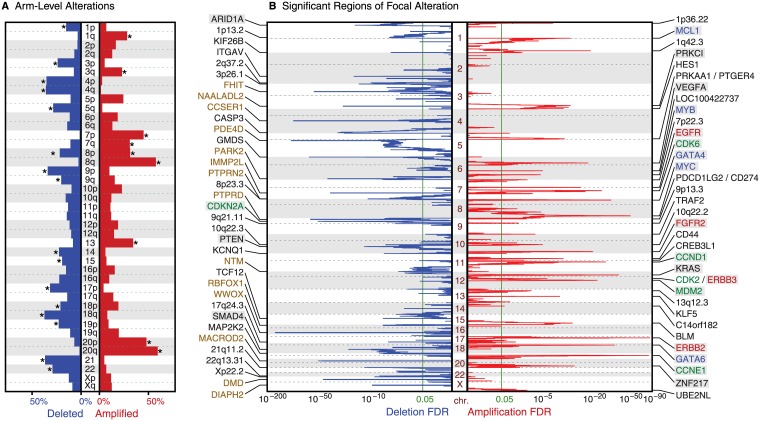
Fig 1. Significant regions of (A) arm-level and (B) focal somatic copy number alteration across the genome (y-axis).
The x-axis indicates frequencies (A) or significance (as FDR q-values, B). Arms considered significant (q<0.05) are marked with an asterisk; the significance levels of focal events are shown as green lines. The 35 most significant focal regions of each SCNA type are labeled by associated single genes, putative drivers, or cytoband location. Labels of known oncogenes and tumor suppressors are highlighted in gray; tyrosine kinase genes are red, cell-cycle genes are green, transcription factors are blue text and large genes are brown.

