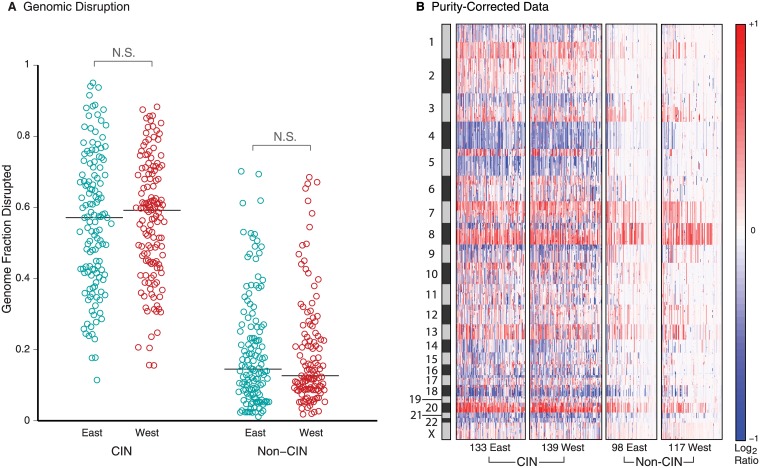
Fig 4. Genomic disruption after purity correction within CIN and non-CIN subtypes.
(A) Genomic disruption using purity-corrected data within samples of each subtype. Circles represent samples and lines represent median values. (B) Purity-corrected copy-number profiles arranged by molecular subtype and East/West cohort. Data are presented as in Fig 3A. “N.S.” indicates p>0.05.

