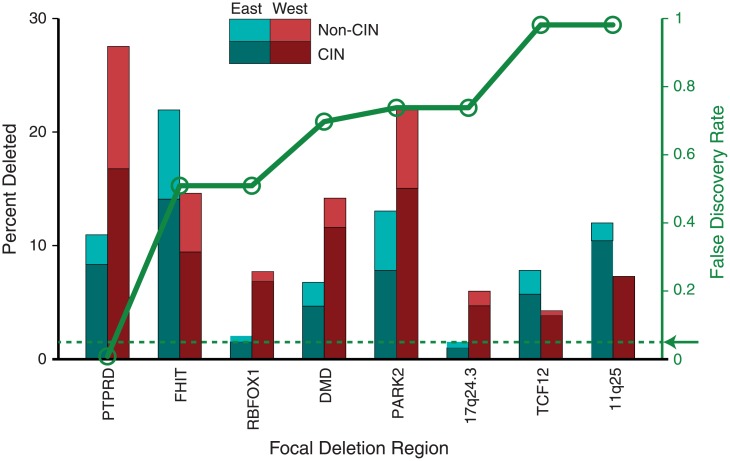
Fig 5. Event frequencies at regions of significant focal SCNA.
A bar chart of comparative event frequencies (black scale) is overlaid with a plot of the significance of the event rate difference (green scale). Only those with FDR q<1.0 (all deletions) are shown. The arrow and dashed line indicate the significance cutoff of 0.05.

