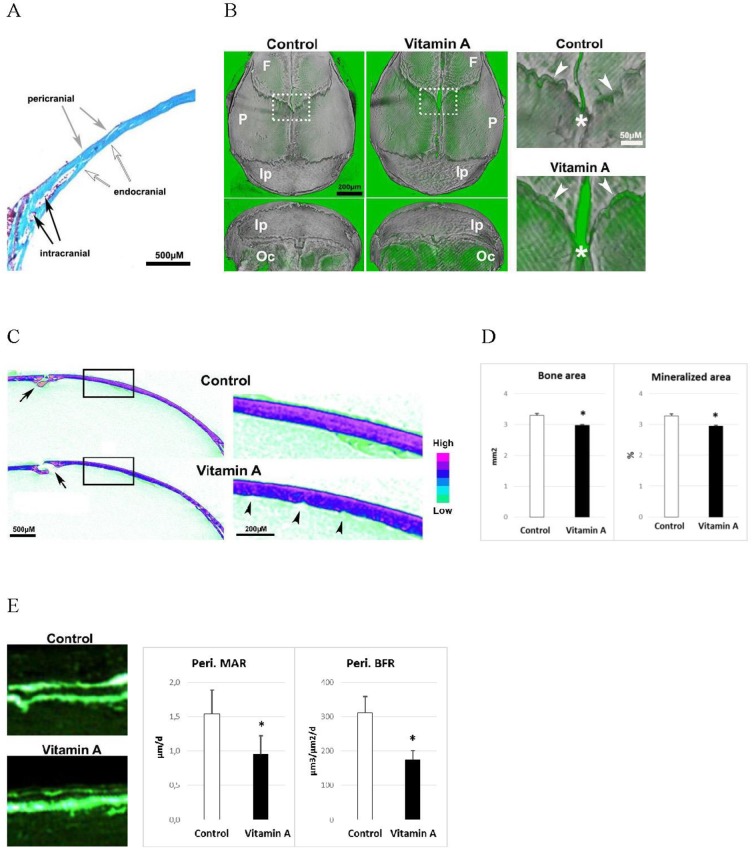
Fig 1. The calvarial bone and osteoblast phenotype.
A) Illustration of peri- (peri), endo- (endo) and intra- (intra) cranial bone surfaces. B) Left panel: μCT picture of a pericranial and a dorsal view of isolated skull bones from mice fed excessive doses of vitamin A and control mice. F = frontal, P = parietal, Ip = Interparietal and Oc = occipital. Right panel are high power pictures of boxed areas in left panel, and show the intersection of the coronal (arrowheads) and sagittal (asterisk) sutures. C) Left panel: representative μCT pictures of transverse sections at the mid parietal bone (sagittal suture, arrow). Right panel: high power pictures of boxed area in the left panel. Arrowheads highlight the rougher endocranial surface in calvarial bone from vitamin A mice. D) Histomorphometric analyses of transverse bone area and mineralized area (n = 4/group). E) Left panel: pictures showing calcein double labelling of pericranial surface. Right panel: dynamic histomorphometric results, from analysis of the calcein double labeling. Pericranial mineral apposition rate (Peri. MAR) and pericranial bone formation rate (Peri. BFR) (n = 4/group). Results are given as means + SD. * p < 0.05.

