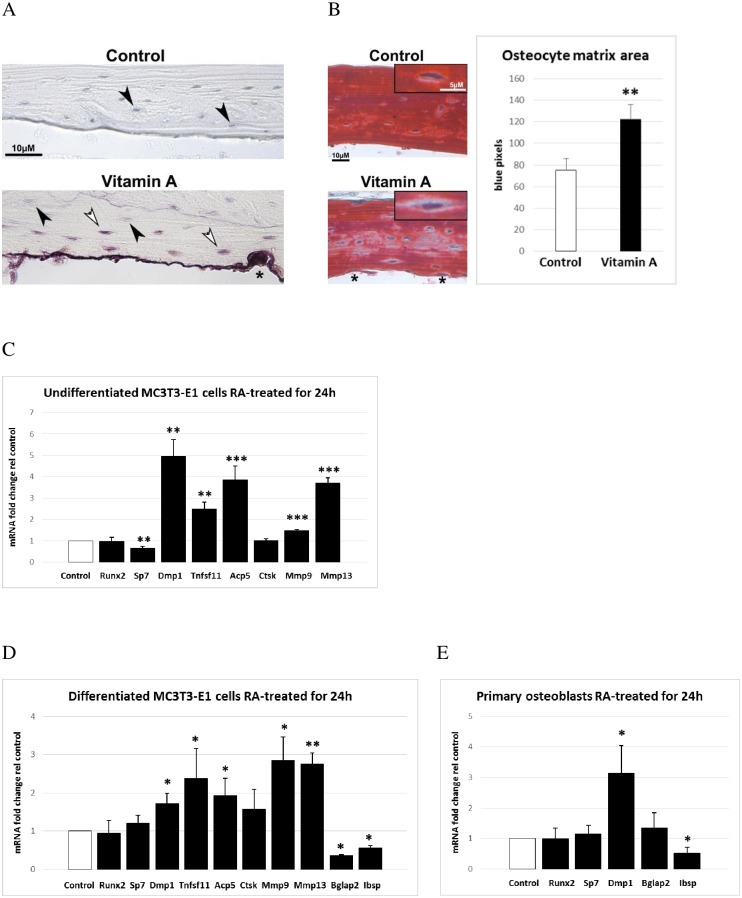
Fig 4. Osteocyte phenotype and RA-induced gene expression in osteoblastic cells.
A) Representative picture of TRAP-stained decalcified bone section from mice fed excessive doses of vitamin A and controls. White arrowheads show TRAP-positive osteocytes close to the osteoclast rich endocranial surface and black arrowheads show TRAP-negative osteocytes. The asterisk indicates osteoclast attached to bone. B) Left panel shows a representative picture of Trichrome stained decalcified bone sections. Inset black box shows magnified osteocytes used for measurement of perilacunar matrix area (blue stain). The asterisks indicate osteoclasts. The right panel shows osteocyte perilacunar matrix area measured as number of blue pixels, analyzed from pictures of Trichrome stained bone sections (n = 10 osteocytes/group and each group contain sections from 3 different individuals). C) Osteoblastic (MC3T3-E1) gene expression after 24h of 400 nM retinoic acid (RA) treatment as determined by quantitative RT-PCR analysis. Runx2 (runt related transcription factor 2), Sp7 (Sp7 transcription factor 7, osterix), Dmp1 (dentin matrix protein 1), Tnfsf11 (tumor necrosis factor ligand superfamily member 11, RANKL), Acp5 (acid phosphatase 5, tartrate resistant, TRAP), Ctsk (cathepsin K), Mmp9 (matrix metalloproteinase 9) and Mmp13 (matrix metalloproteinase 13). D) Mature osteoblastic/osteocytic (differentiated MC3T3-E1 cells) gene expression after 24h of 400 nM retinoic acid (RA) treatment as determined by quantitative RT-PCR analysis. Bglap2 (bone gamma-carboxyglutamate protein 2, osteocalcin), Ibsp (integrin binding sialoprotein) and as described in (C). E) Primary mouse calvaria osteoblast gene expression after 24h of 400 nM retinoic acid (RA) treatment as determined by quantitative RT-PCR analysis. Results are given as means + SD. * p < 0.05, ** p < 0.01 and *** p < 0.001.

