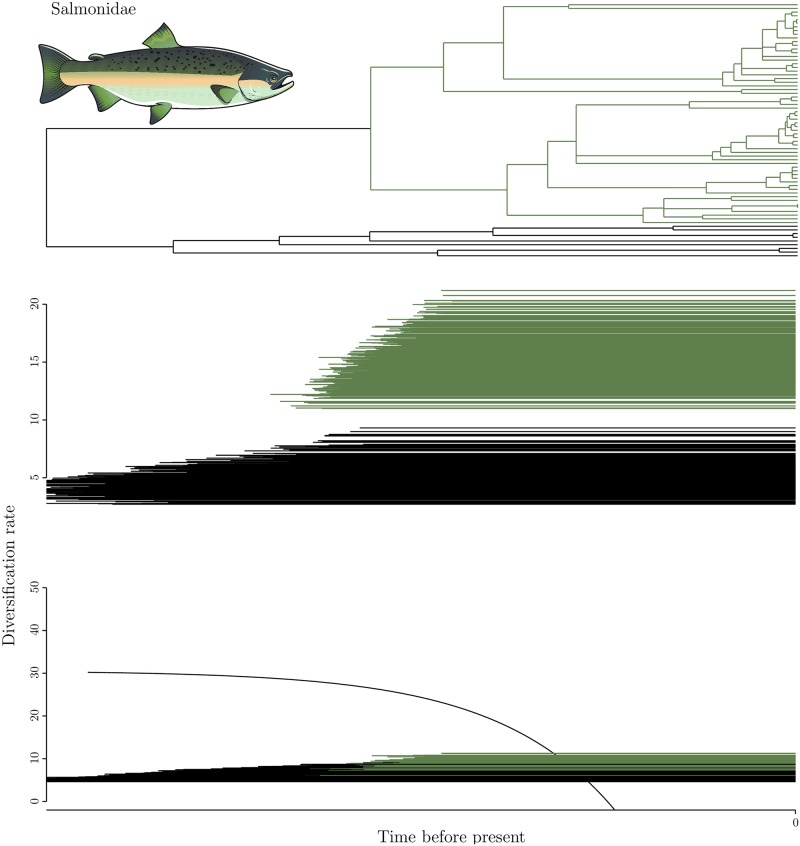
Fig 1. Results for the Salmoniformes and Esociformes phylogeny.
The black clade represents the diploid Esociformes, the dark green clade the tetraploid Salmoniformes. Top: consensus phylogenetic tree; middle: TreePar analysis; bottom: function-fitting. One line represents the result for one diploid or polyploid clade extracted from one the 500 hundred trees. Constant diversification models were preferred with every analysis, as no TreePar results includes a break in diversification value, and as only constant functions were chosen by the function-fitting method except for one outlier diploid clade. The analysis were run with the sampling ratios extracted from Zhan et al. [45]: 0.69 for the polyploid clade and 0.28 for the diploid one.

