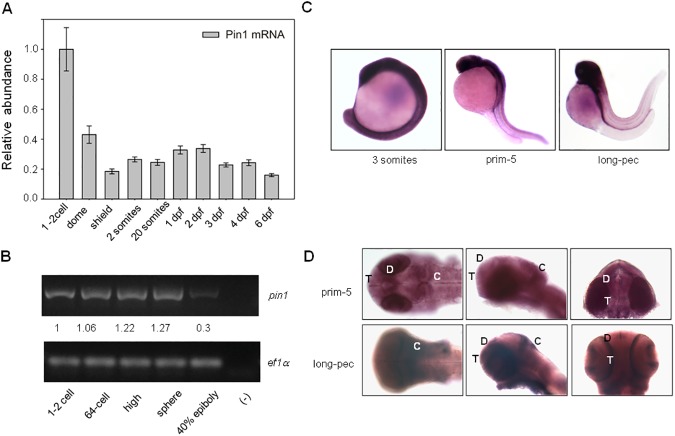
Fig 1. Analysis of pin1 mRNA levels and distribution during zebrafish development.
(A) pin1 mRNA levels were monitored by RT-qPCR on cDNA from embryos of the indicated stages: 1–2 cell (0 hpf), dome (4:30 hpf), shield (6 hpf), 2 somites (10:30 hpf), 20 somites (19 hpf),1 dpf, 2 dpf, 3 dpf, 4 dpf and 6 dpf. Data was normalized using elongation factor 1α(ef1α) and ribosomal protein L13a (rpl13a) mRNA levels as internal controls and is shown as relative abundance comparing with 1–2 cell stage. (B) Analysis of pin1 mRNA levels by semi quantitative RT-PCR: 1-2-cell (0 hpf), 64-cell (2 hpf), high (3:30 hpf), sphere (4 hpf) and 40%-epiboly (5 hpf). As an internal control, ef1αwas amplified on the same cDNA samples. Signal intensity was quantified using ImageJ software and expressed relative to 1–2 cell stage. (C) pin1 mRNA distribution in whole embryos at the indicated developmental stages analysed by in situ hybridization (100 x magnification). (D) pin1 mRNA pattern in the head at prim-5 (24 hpf) and long-pec (48 hpf) stages. Left: dorsal, center: lateral, right: frontal (200 x magnification). hpf, hours post-fecundation, dpf, days post-fecundation. T: telencephalon, D: diencephalon, C: cerebellum.

