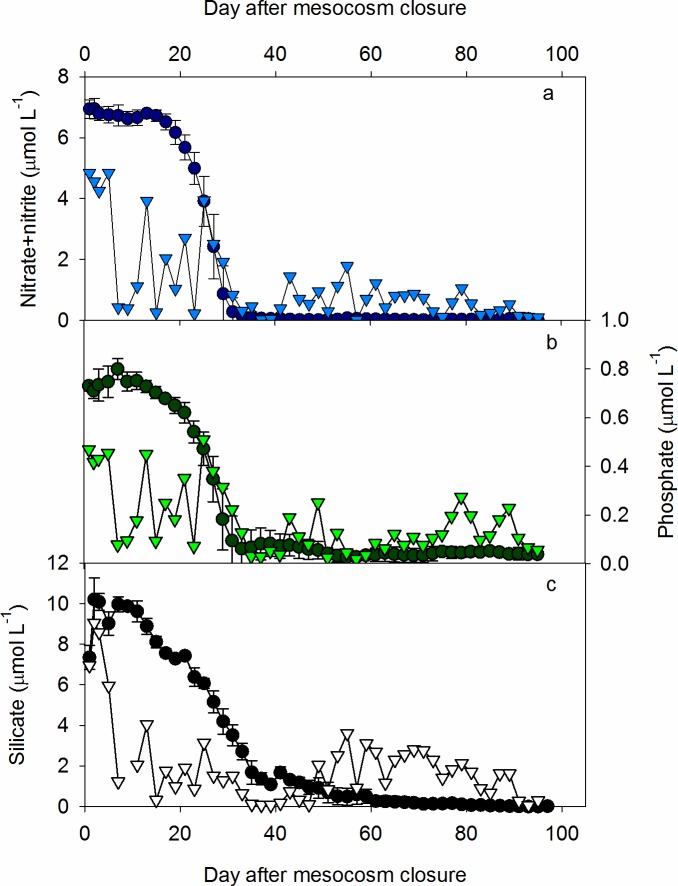
Fig 2. Average nutrient concentrations from a depth integrated water sampler (0–18 m).
(a) nitrate + nitrite, (b) phosphate and (c) silicate in the mesocosms (circles) and adjacent fjord (triangles) throughout the experiment. Values for mesocosms are expressed as the average ± standard deviation (n = 10).

