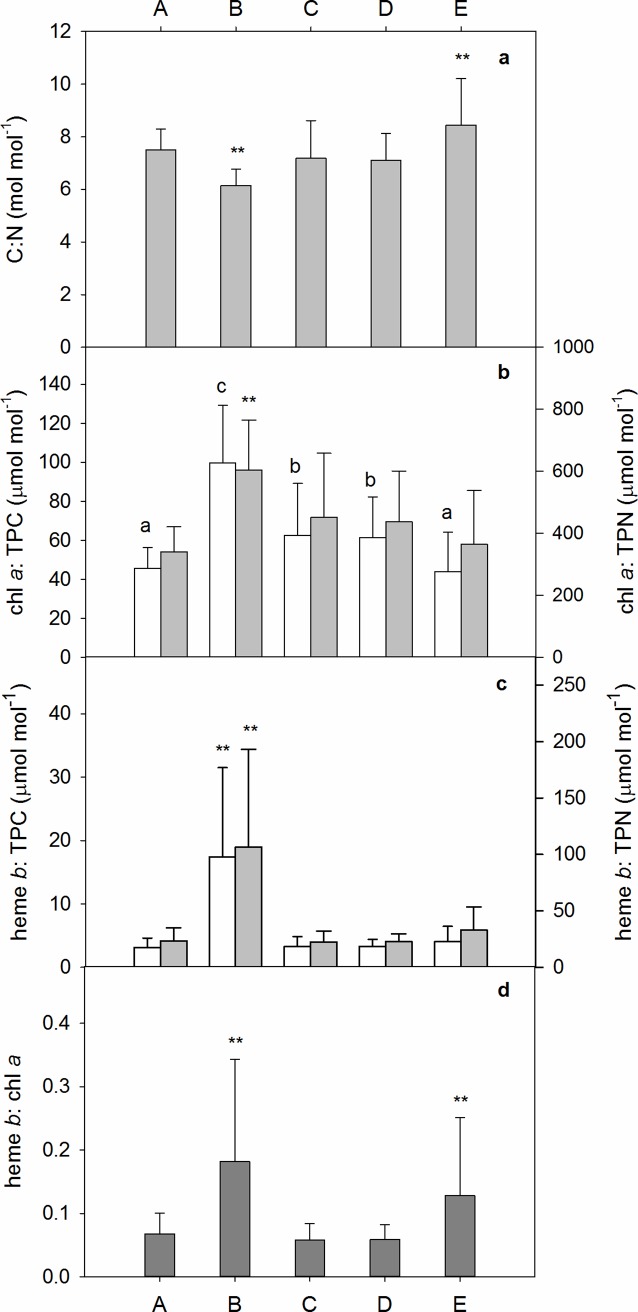
Fig 4.
Mean (± S.D.) ratios of key variables during each defined period in the mesocosms (A—E). Asterisks indicate periods that were significantly different. a: C:N, b: chl a: TPC (white bars) and chl a: TPN (grey bars), bars with the same letter are not significantly different from one another, c: heme b: TPC (white bars) and heme b: TPN (grey bars), d: heme b: chl a

