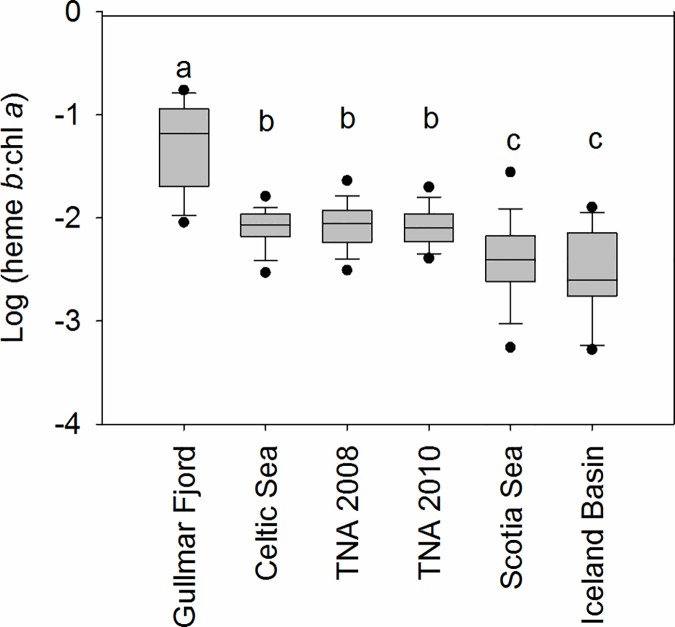
Fig 6. Box and whisker plot for log(heme b: chlorophyll a) values reported.
From Gullmar Fjord (this study, n = 19), Celtic Sea (n = 27), (sub)-tropical North Atlantic in 2010 (n = 377; [6]) tropical North Atlantic in 2008; (n = 268), Scotia Sea (n = 34) and the Iceland Basin (n = 83, [12]). Black circles indicate the 5th/95th percentile for log(heme b: chlorophyll a). Letters denote significantly different groups (one way non parametric ANOVA, p<0.01).

