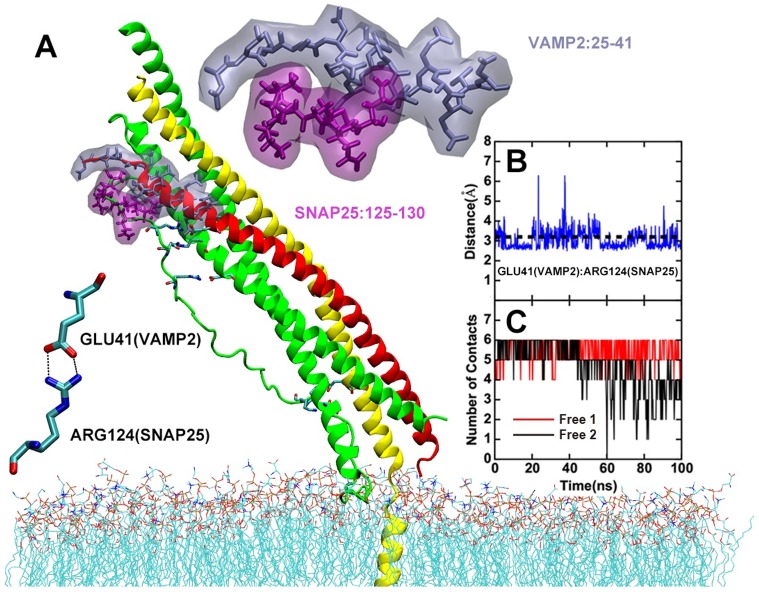
Fig 3. LL region of SNAP25 forms interactions with VAMP2.
(A)snapshot of the free MD simulation. The interactions on the N-terminal residues of NTD region are highlighted, with VAMP2 residues 25 to 41 shown in gray and SNAP25 residues 125–130 shown in purple. A specific salt bridge between VAMP2 E41 and SNAP25 R124 is also indicated. (B)The time-course of the distance VAMP2 E41 and SNAP25 R124 for Free2, a distance below 3.2Å can be viewed as salt bridge fromed. (C)Number of contacts between of SNAP25 with VAMP2 residues 24 to 41.

