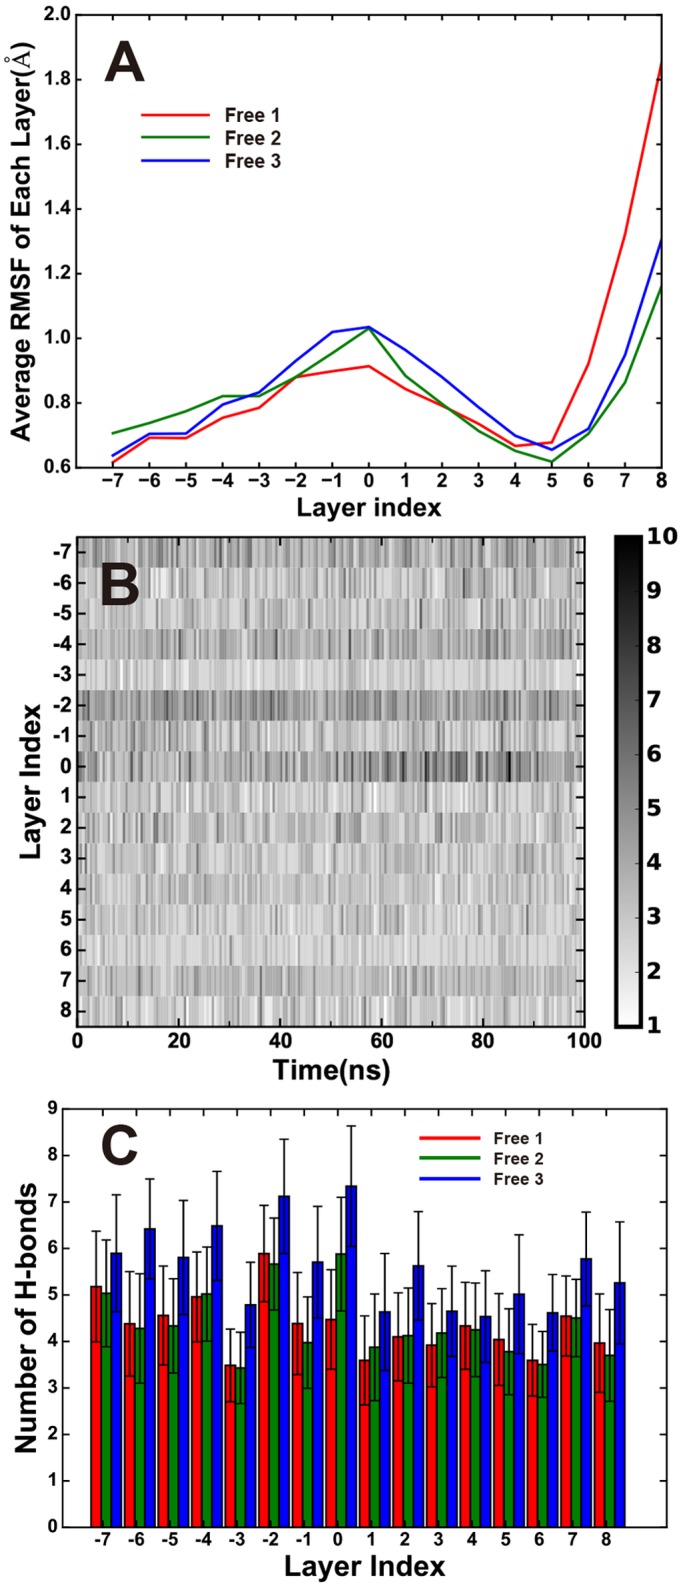
Fig 4. The dynamics of each SNARE layer.

(A)Averaged root mean squared fluctuation of each layer in the simulations. (B) Time-course of the numbers of hydrogen bond between the layer residues with their surroundings for each layers. (C)Average number of Hydrogen bond between the layer residues with their surroundings for the last 20 ns of the two simulation (80–100 ns).
