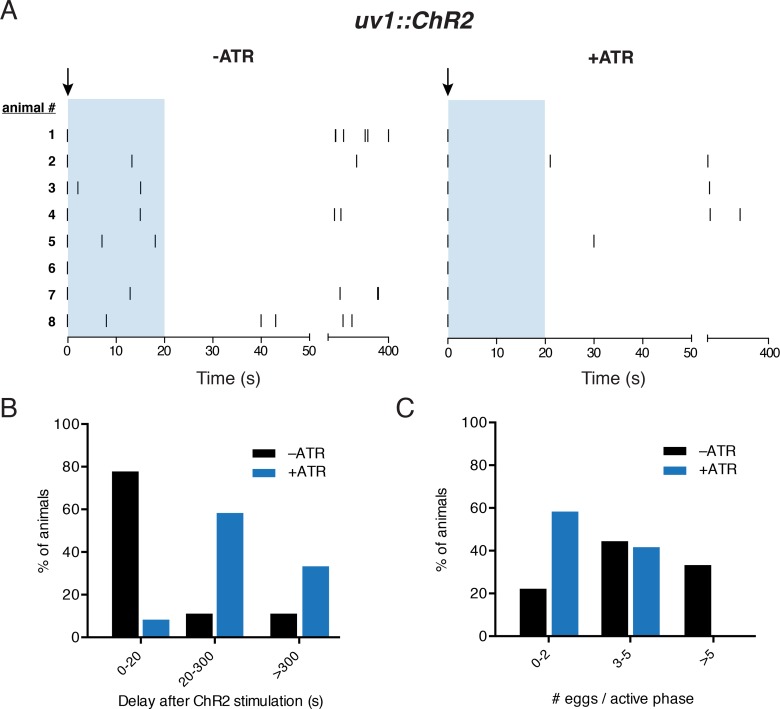
Fig 2. Acute stimulation of uv1 cells inhibits egg-laying activity.
(A) Temporal analysis of egg-laying behavior for 400 s immediately following photostimulation of animals stably expressing ChR2 in the uv1 cells (vsIs189; Pocr-2::ChR2::YFP::ocr-2 3’UTR) under control conditions (-ATR) or with exposure to exogenous retinal (+ATR). Light stimulation (indicated by arrow)(5 s, 100 W/m2) was initiated immediately after the first egg-laying event of an active phase. Tick marks indicate single egg-laying events. Representative data from 8 animals for each condition is shown. Blue shading indicates the 0–20 s time interval quantified in Fig 2B (0–20). Two time periods are shown: (1) 50 s immediately following the first egg-laying event (0–50) and (2) the subsequent 350 s (50–400) on a condensed scale. (B) Quantification of time interval between the onset of light stimulus and subsequent egg-laying event. Percent of animals responding within 20 s, 20–300 s, or after >300 s is shown as indicated. -ATR: n = 9, +ATR: n = 12, p<0.0001, Chi-square test. (C) Quantification of total egg-laying events following the initial event within an active phase. Percent of animals laying 0–2, 3–5, or >5 eggs is shown as indicated. -ATR: n = 9, +ATR: n = 12, p<0.0001, Chi-square test.

