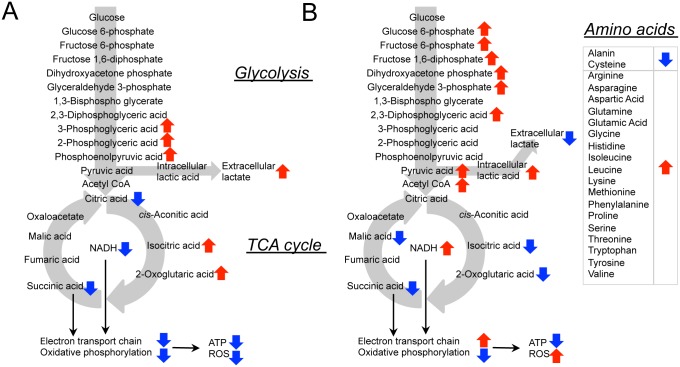
Fig 7. ONS-76, -F8 and DCA-treated cells exhibit different metabolic profiles.
Schematic diagram of the metabolic pathway. The red and blue arrows represent increased and decreased metabolite concentrations in ONS-F8 compared with ONS-76 (A), and in DCA-treated cells compared with non-DCA-treated cells (B).

