
Fig 4. CCEae3a diversity.
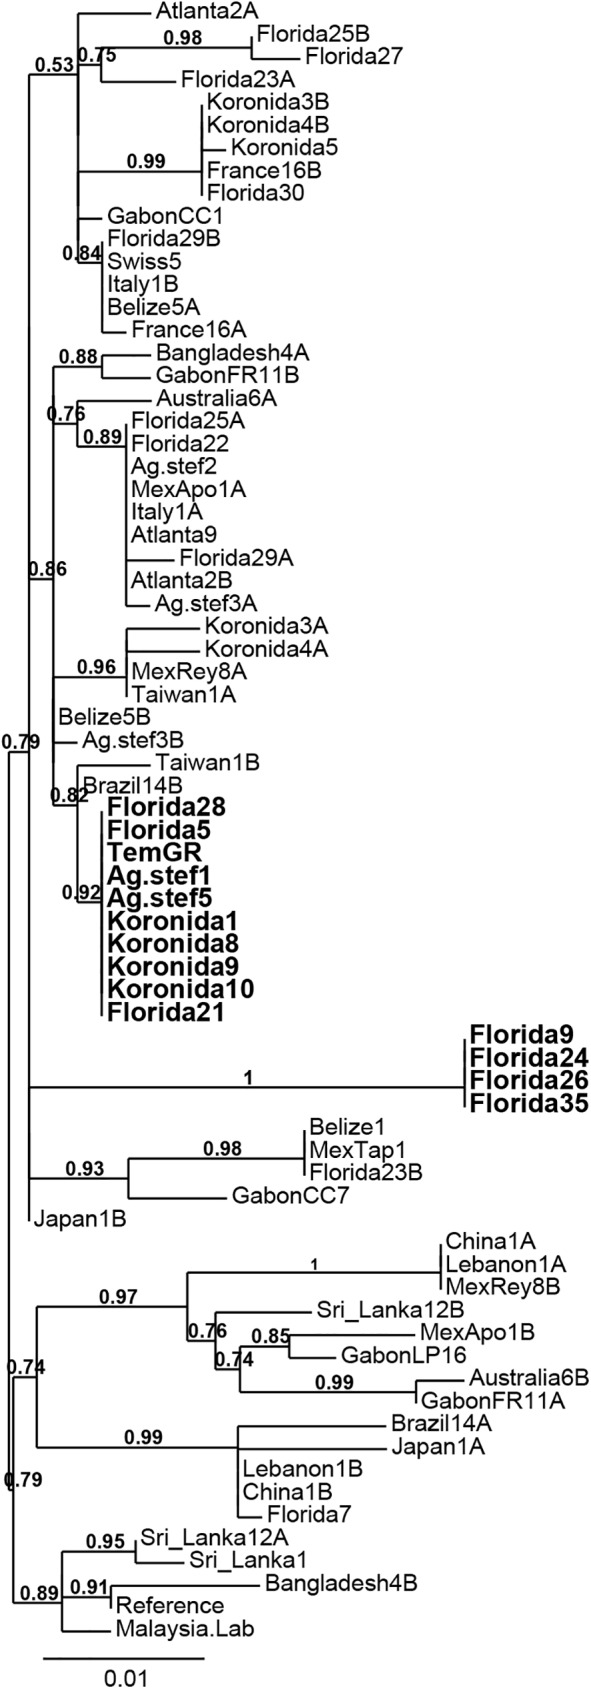
An unrooted maximum likelihood tree was built to represent the phylogenetic distances between the 45 CCEae3a haplotypes identified worldwide (see also S1 Table). Distances are expressed in substitutions/site. The numbers on tree branches represent the supporting probability of each node, based on the aLRT statistical test. Individuals with copy number variation are shown with bold.