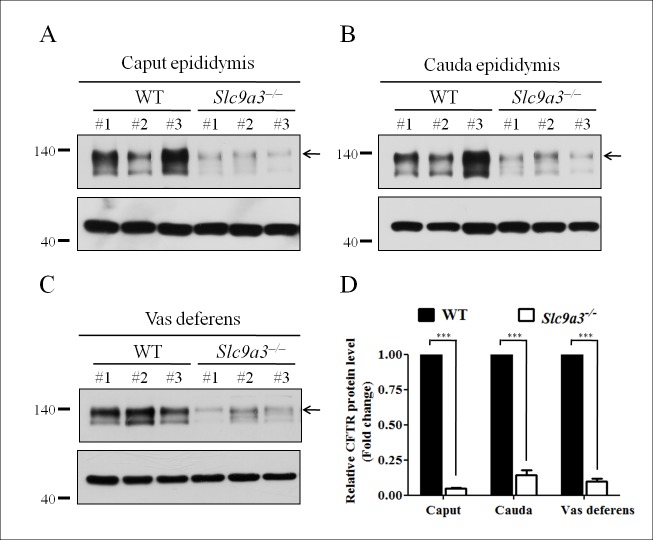
Fig 1. CFTR is prominently reduced in the epididymis and vas deferens of Slc9a3-/- mice.
(A, B, C) CFTR expression in the caput (A) and cauda (B) epididymis and vas deferens (C) of 2-month-old Slc9a3-/- mice compared with that in WT mice was assessed by western blotting. In each panel, the upper image shows the CFTR expression (arrow indicates the fully glycosylated form) and the lower image shows the β-actin expression, which was used as a loading control. Each group comprised three WT and Slc9a3-/- mice. (D) Western blotting results were quantified through a morphometric analysis. For each organ, the CFTR intensity was normalized to that of β-actin expression, and the mean intensity in WT mice was used as a reference to calculate the fold change in expression in Slc9a3-/- mice. Each bar represents the mean ±SEM; n = 3 per genotype. *Significant difference compared with WT mice (***p < 0.0001, analyzed using the Student’s t test).

