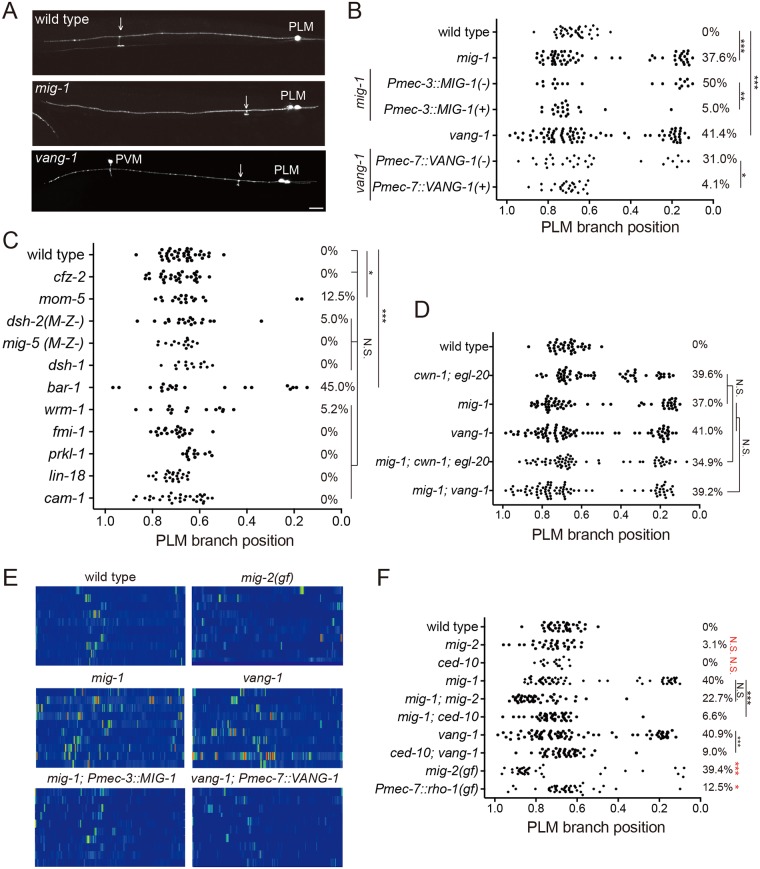
Fig 4. Frizzled and PCP components pattern PLM branching positions.
(A) Confocal images of PLM branches in the wild type, mig-1 and vang-1 mutants. Arrows mark the PLM branch. PVM is another touch neuron. Scale bar = 10 μm. (B-D) PLM branching pattern in canonical and non-canonical Wnt pathway mutants. *, p < 0.05; **, p < 0.01; ***, p < 0.005; N.S., two proportion z test with Bonferroni correction. N > 25. (E) Heat maps of COR-1::mCherry(twnEx195) intensity in the PLM process of indicated genotypes three hours post-hatching. N = 10 animals each. (F) PLM branching pattern in indicated genotypes. **, p < 0.01; ***, p < 0.005; N.S., not significance, two proportion z test with Bonferroni correction. N > 25. Statistic results between wild-type and gain-of-function or loss-of-function mig-2 and ced-10 single mutants were shown in red. N > 25.

