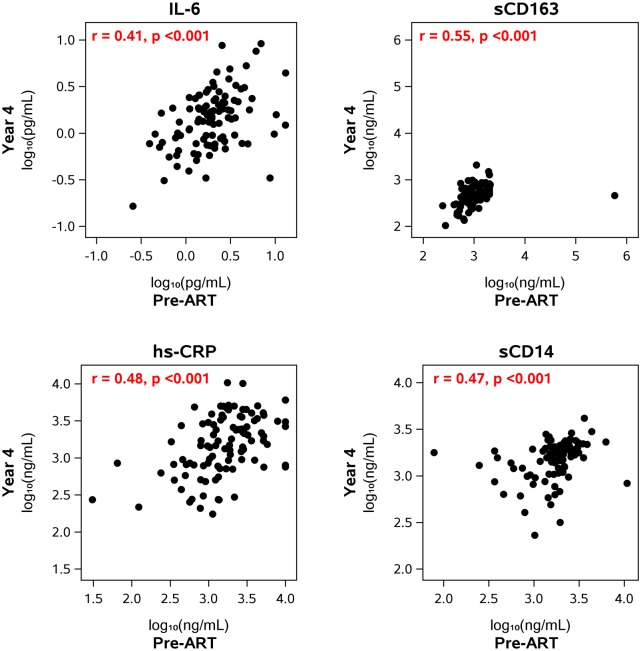
Fig 5. Correlation between pre- and on-ART levels of inflammatory biomarkers.
The figures show the correlation between the levels of the biomarkers before starting ART and the levels at year 4 after starting therapy. The levels at the other on-ART time points (year 1, years 6–15) also correlated with the levels before starting ART (Table 2).

