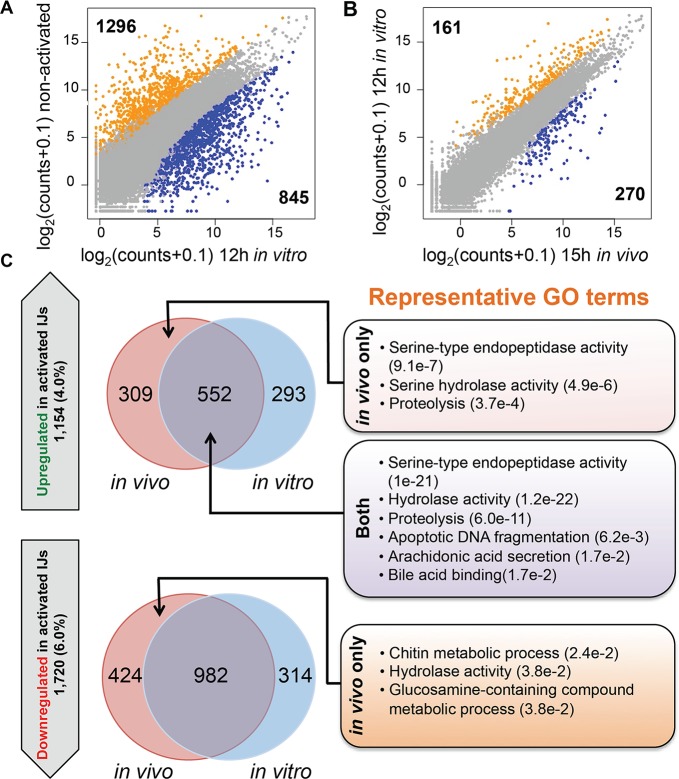
Fig 4. The gene expression profile of the 12 hour in vitro activated nematodes is most similar to that of 15 hour in vivo activated nematodes.
(A) Scatterplot comparing the average gene expression counts of non-activated IJs and 12 hr in vitro activated IJs. Genes colored in orange and blue are differentially expressed (FDR < 0.05 and fold change > 2) and have higher expression in non-activated IJs and 12 hr in vitro activated IJs respectively. (B) Scatterplot comparing the average gene expression counts between 12 hr in vitro and 15 hr in vivo activated IJs. Genes colored in orange and blue are differentially expressed (FDR < 0.05 and fold change > 2) and have higher expression in 12 hr in vitro and 15 hr in vivo activated IJs respectively. (C) Venn diagrams showing genes that are upregulated and downregulated in the 12 hr in vitro and 15 hr in vivo activated IJs relative to non-activated IJs. The total number of upregulated and downregulated genes and their genome percentages are shown in the upward and downward block arrows, respectively. Representative GO terms and p-values for each category are listed on the right. Categories that do not have GO terms had no significant enrichment results.

