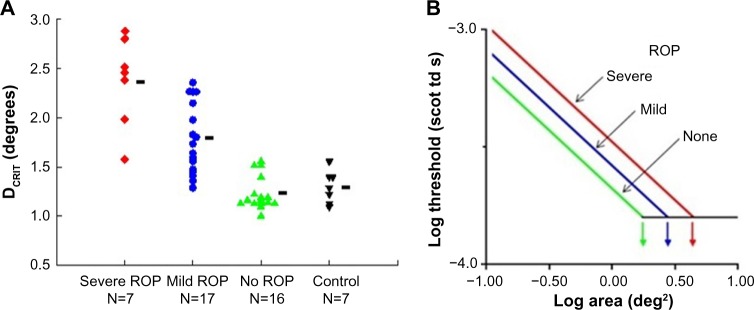
Figure 3.
Rod-mediated spatial summation.
Notes: (A) DCRIT values in severe ROP, mild ROP, no ROP, and term-born control groups are plotted. Each point represents an individual subject; the number of subjects in each group is indicated. The horizontal bars indicate the mean DCRIT value for each group. (B) The log–log plot demonstrates that reciprocity held. In every subject group, for the smaller spots, threshold became lower (more sensitive) with increasing stimulus area. For larger diameter spots, the threshold did not change; summation was complete. (A) Copyright © 2014. Association for Research in Vision and Ophthalmology. Adapted from Hansen RM, Tavormina JL, Moskowitz A, Fulton AB. Effect of retinopathy of prematurity on scotopic spatial summation. Invest Ophthalmol Vis Sci. 2014;55(5):3311–3313.27
Abbreviations: DCRIT, critical diameter; ROP, retinopathy of prematurity.

