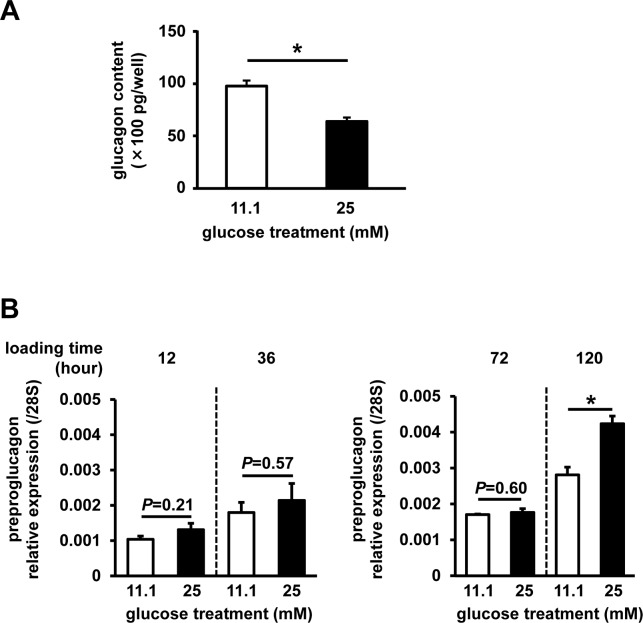
Fig 2. Glucagon content and preproglucagon expression.
Cells were pretreated with 11.1 mM (white) or 25 mM (black) glucose. (A) Glucagon content following static incubation (n = 3–4, each group). (B) Preproglucagon expression (n = 6, each group). Data are expressed as mean ± SEM; *P<0.05, between the indicated groups.

