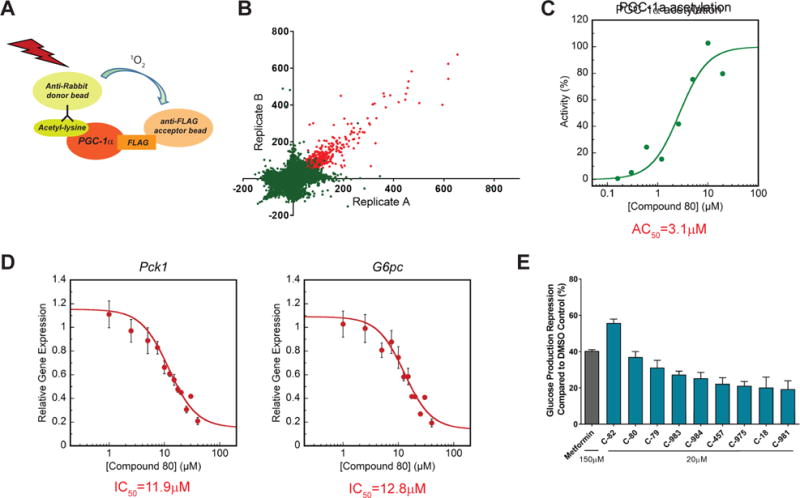
Figure 1. AlphaLisa based high-throughput screen identifies small molecules with inhibitory effect on glucose production in isolated hepatocytes.

See also Fig. S1.
(A) AlphaLisa assay was used to detect acetylation status of PGC-1α in lysates obtained from U-2 OS cells over expressing PGC-1α and GCN5.
(B) Scatter plot of primary screen results. A total of 741 compounds that induced acetylation signal by ≥50% compared to control were identified and considered active (red dots). Axes represent activity score (percentage change in acetylation relative to vehicle control).
(C) The effect of the primary screen hits on PGC-1α acetylation was re-tested in a dose response manner. Dose response curve of lead compound (C-80) is presented as an example.
(D) Isolated mouse primary hepatocytes were used to determine the effect of remaining hits on Pck1 and G6pc gene expression (see also figure S1C). Forskolin was used to induce Pck1 and G6pc expression (considered as 100% activation) and cells were treated with each compound at dose. Data was fit to the Hill equation to calculate estimated AC50. A more accurate dose response curve of lead compound (C-80) was re-generated in-house. For further details, please refer to STAR methods.
(E) Repression of glucose production from hepatocytes following treatment with screen hits. Hepatocytes were infected with Ad-PGC-1α and Ad-GCN5 to induce glucose production. Cells were treated overnight with an overall of 19 compounds, that were identified in the qPCR assay. Pyruvate/lactate were used as substrates for glucose production. Compounds that significantly reduced glucose levels in the medium compared to DMSO control are presented.
