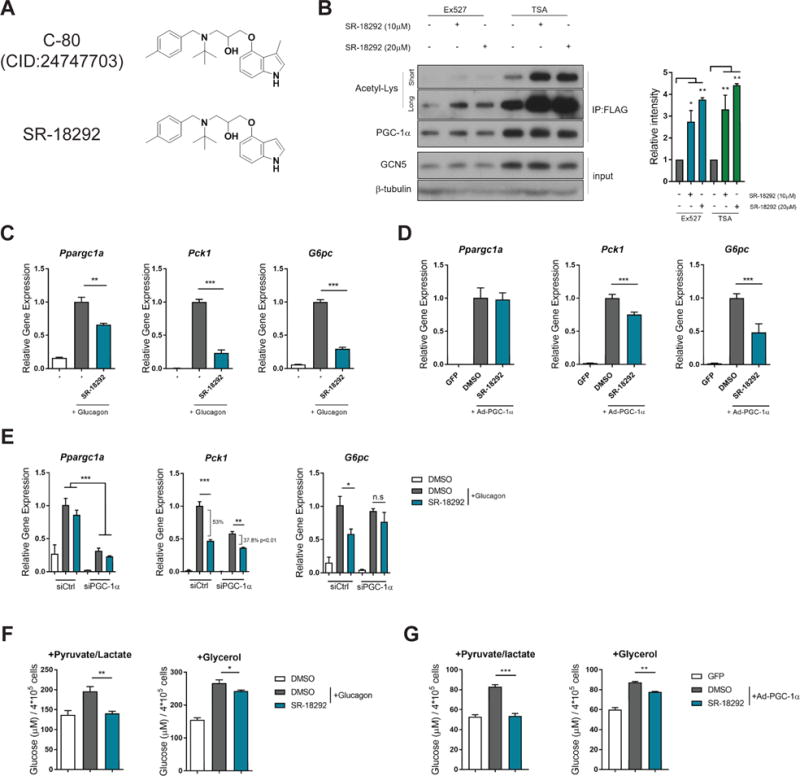
Figure 2. Effects of SR-18292 on PGC-1.

α acetylation and gluconeogenic genes in isolated primary hepatocytes. See also Fig. S2.
(A) SR-18292 is identical to C-80 except the methyl group on the 3′ position on the indole group.
(B) Western blot analysis of PGC-1α acetylation following treatment with SR-18292 in the presence of the SIRT1 inhibitor, Ex527 (5μM) and the pan HDACs inhibitor TSA (1μM). Hepatocytes were infected with Ad-PGC-1α and Ad-GCN5 and treated with SR-18292 for 18 h. IP, immunoprecipitation.
(C) – (D) qPCR analysis of Ppargc1a, Pck1 and G6pc mRNA expression levels following treatment with SR-18292 (20μM) in isolated primary hepatocytes.
(E) qPCR analysis of Ppargc1a, Pck1 and G6pc mRNA expression levels following SR-18292 (20μM) treatment and siRNA to reduce to expression of Ppargc1a. Difference in % repression of Pck1 was calculated using two-way ANOVA with Sidak posttest.
(F) – (G) Glucose production by primary hepatocytes following treatment with SR-18292 (20μM). Hepatocytes were treated with either glucagon (200nM) or infected with Ad-PGC-1α to induce glucose production.
All data presented as mean +/− S.E.M. n=3, one-way ANOVA with Tuckey posttest. Representative of at least 2 independent experiments. *P<0.05, **P<0.01, ***P<0.001. n.s=not significant
