
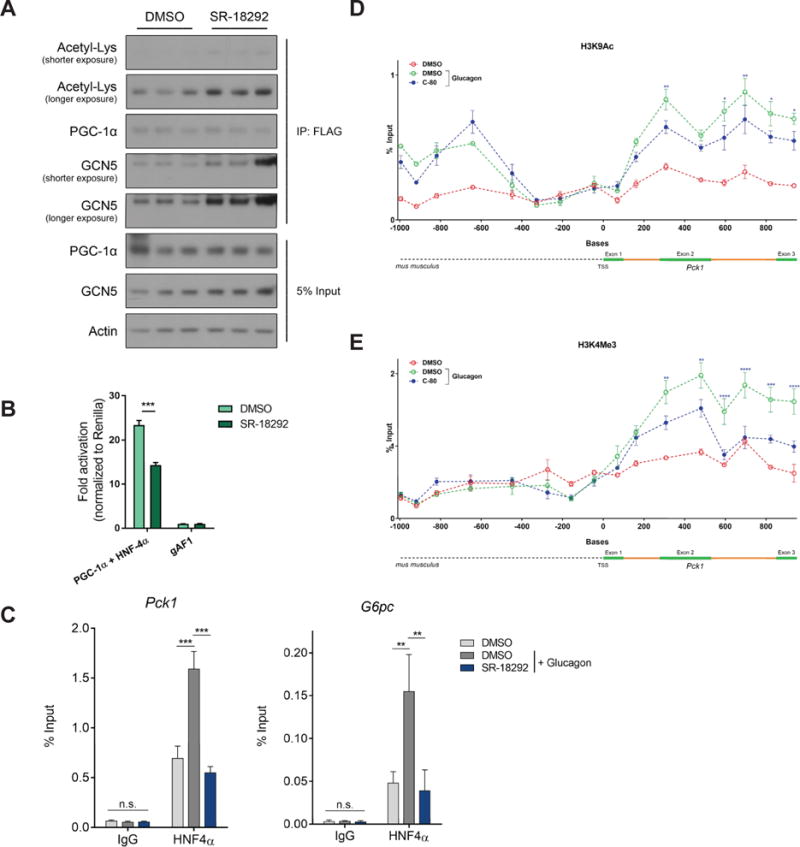
Figure 3. SR-18292 increases interaction of GCN5 with PGC-1 α and reduces transcriptional activity of HNF4α.
See also Fig. S3.
(A) Co-IP of FLAG-PGC-1α following treatment with SR-18292 (10μM). IP, immunoprecipitation.
(B) U-2 OS cells were transfected with the indicated plasmids and luciferase reporter levels were measured after 24 hours. n=3, two-way ANOVA with Sidak posttest. Representative of at least 2 independent experiments.
(C) The Pck1 and G6pc promoters’ occupancy by HNF4α was determined following chromatin IP (ChIP) using HNF4α specific antibody. Glucagon (200nM) was used to promote HNF4α binding to these promoter regions. n=3, one-way ANOVA with Tuckey posttest. Representative of at least 2 independent experiments.
(D) and (E) H3K9Ac and H3K4me3 marks on Pck1 gene are reduced upon treatment. n=3, two-way ANOVA with Tuckey posttest.
*P<0.05, **P<0.01, ***P<0.001.