
Figure 5. SR-18292 suppresses HGP in vivo.
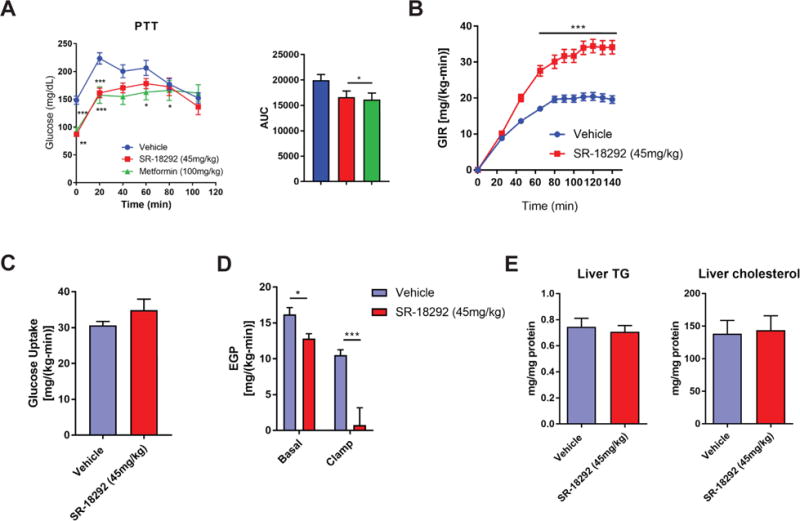
(A) PTT following treatment with SR-18292 and metformin in mice fed HFD for 17 weeks. n=10/vehicle, n=10/SR-18292, n=7/Metformin. Two-way ANOVA with Sidak posttest.
(B) – (D) hyperinsulinemic euglycemic clamp studies from mice fed HFD for 16 weeks. Glucose infusion rate (GIR), glucose uptake and endogenous glucose production (EGP) are presented. n=9/vehicle, n=7/SR-18292.
(E) Liver triglycerides and cholesterol levels from livers isolated from mice fed HFD for 17 weeks and treated with SR-18292. n=10.
*P<0.05, **P<0.01, ***P<0.001. AUC, area under the curve.