Figure 2.

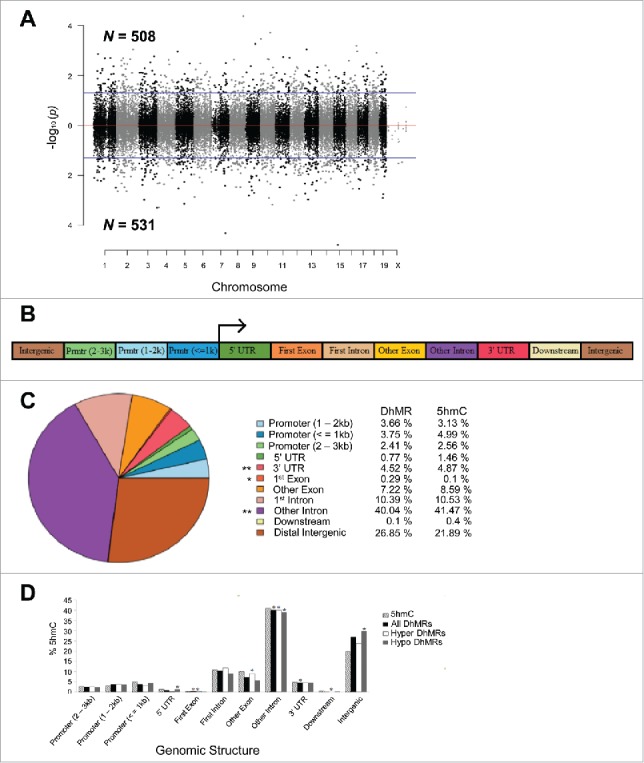
Characterization of DhMRs across standard genomic structures. (A) Modified Manhattan plot of early-life stress-associated DhMRs from the mouse hypothalamus reveals DhMRs to be distributed across the entire genome. Positively and negatively correlated DhMRs are displayed with the -log10 of the P-value. Significant DhMRs are displayed outside the purple lines (P-value < 0.05), while all DhMRs alternate between black and gray to indicate each chromosome. (B) Schematic of the standard genomic structures investigated. DhMR and all 5hmC data were annotated to the following genomic features: 3 promoter (Prmtr) regions located 2–3 kb, 1–2 kb, and up to 1 kb upstream (≤ 1 kb) of the transcription start site; the 5′ untranslated region (UTR); first exon; first intron; other exon; other intron; 3′ UTR; up to 3 kb downstream of transcription end site (≤ 3 kb); and the intergenic regions (> 3 kb upstream or downstream of nearest gene). (C) Pie chart displaying the proportion of all DhMRs falling into each investigated genomic structure. Structures containing a significant over- or under-representation of DhMRs when compared with all 5hmC peaks are indicated (*), which were determined by permutation testing (P-value < 0.05). Columns indicate the percent of all 5hmC peak data (5hmC) and DhMRs in each genomic structure shown. (D) A breakdown of hyper- and hypo-DhMRs in each genomic structure. The percent distribution (y-axis) of all 5hmC peak data (striped), DhMRs (black), hyper-DhMRs (white), and hypo-DhMRs (gray) in each genomic structure is shown. Significant over- and under-representation of DhMRs are indicated (*) for each structure (P-value < 0.05).
