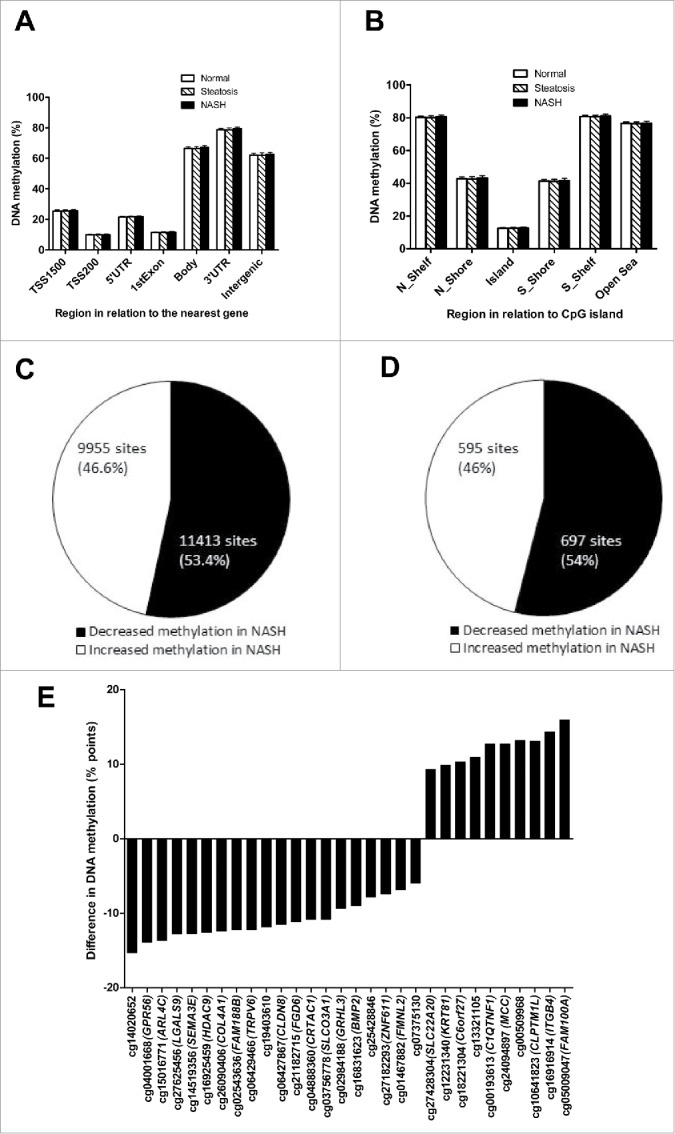
Figure 1.

Global DNA methylation in human liver from normal, steatosis and NASH individuals is shown for (A) each gene region and (B) CpG island regions. Global DNA methylation is calculated as average DNA methylation based on all CpG sites in each annotated region on the Infinium HumanMethylation450 BeadChip. TSS, proximal promoter, defined as 200 or 1,500 bp upstream of the transcription start site. Shore, flanking region of CpG islands (0–2,000 bp); Shelf, regions flanking island shores (2,000–4,000 bp from the CpG island). N, northern; S, southern. Pie chart describing the number of sites that exhibit increased or decreased DNA methylation in NASH at (C) q < 0.05 and (D) q < 0.001 and ≥ 5% point difference. (E) CpG sites displaying the most significant increased or decreased DNA methylation (q < 0.001 and at least 5% point change) in NASH.
