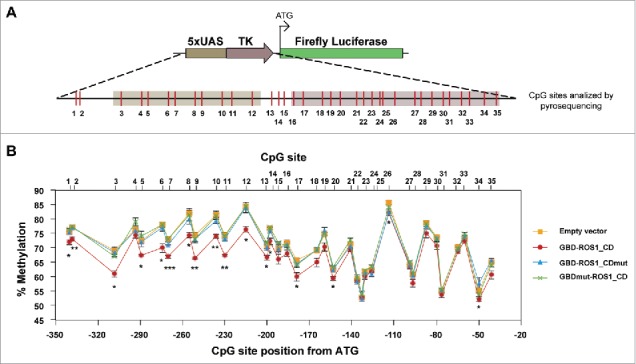
Figure 5.

DNA methylation analysis of the targeted 5xUAS-TK region after transient expression of GBD-ROS1_CD. (A) Schematic diagram of the analyzed region. CpG sites are shown in red. (B) Quantitative methylation analysis. Cells were co-transfected with the indicated effector construct and the targeted methylated reporter plasmid. Plasmid DNA was re-isolated 48 h after co-transfection, bisulfite-treated, PCR-amplified, and pyrosequenced. The graph shows the percentage of methylation at different positions. Values are means ± SE (error bars) from three independent transfection experiments. Asterisks indicate statistically significant differences between GBD-ROS1 and the empty vector (*: P < 0.05; **: P < 0.01; ***: P < 0.001; Student's unpaired t-test).
