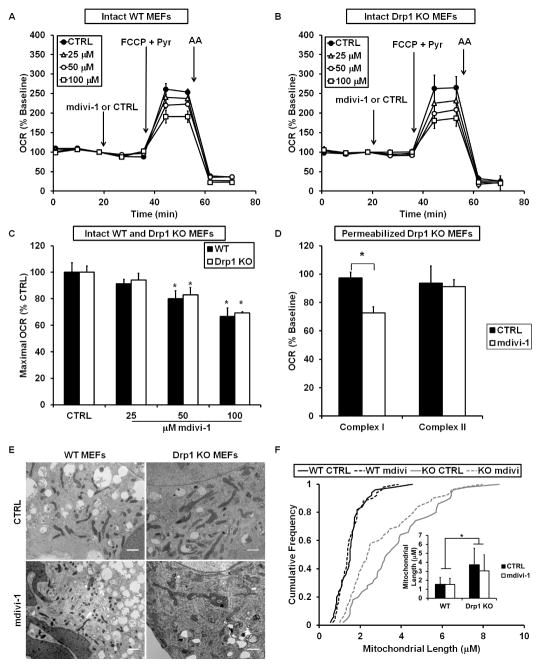
Figure 4. Mdivi-1-induced respiratory inhibition is not mimicked by Drp1 KO or dependent upon Drp1 expression.
WT (A) or Drp1 KO (B) MEFs were treated with mdivi-1 (25–100 μM) or vehicle followed by FCCP (3 μM) plus pyruvate (10 mM) and antimycin A (AA, 1 μM) while OCR was measured. Traces here and below are mean ± SD of 3 wells and representative of at least 3 experiments. (C) Maximal OCR calculated immediately following FCCP plus pyruvate addition, expressed as a percentage of the maximal rate in vehicle-treated cells (mean ± SD, n=3). (D) Drp1 KO MEFs were permeabilized with 5 μg/mL saponin, along with ADP (1 mM) and either pyruvate and malate (5 mM each) or succinate (5 mM) in the presence of rotenone (0.5 μM). MEFs were then treated with 50 μM mdivi-1 or vehicle (CTRL). OCR is expressed as a percentage of OCR prior to drug injection. Results are mean ± SD, n=3. * p<0.05 compared to control. (E) Electron micrographs of WT or Drp1 KO MEFs treated with CTRL or mdivi-1 (50 μM) for 16 min. Scale bars = 1 μm. (F) Cumulative frequency distribution plot for mitochondrial length in WT or Drp1 KO MEFs ± mdivi-1. Bar graph inset is mean mitochondrial length ± SD. Results are from 50 mitochondria from 2 different experiments. See also Figures S4–S6.

