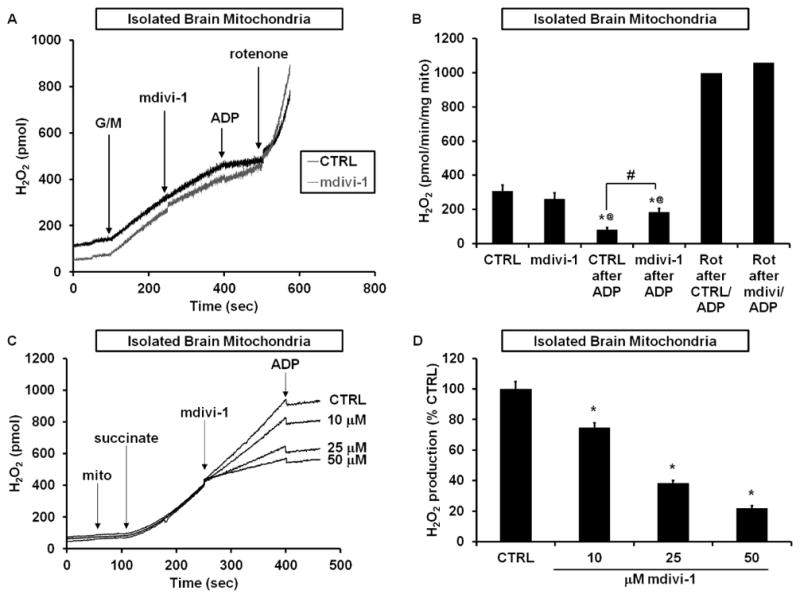
Figure 7. Mdivi-1 modulates ROS production by brain mitochondria as predicted by Complex I inhibition.

(A) Representative traces depicting H2O2 production by isolated brain mitochondria oxidizing glutamate and malate (G/M, 5 mM each) before and after addition of DMSO (CTRL) or mdivi-1 (50 μM), followed by addition of ADP (2 mM), and then rotenone (1 μM). (B) Quantification of the data in (A) (mean ± SD, n=5). * p<0.05 compared to control, @ p<0.05 compared to the respective condition with no ADP, # p<0.05 for mdivi-1 rate after ADP compared to control rate after ADP. Each rotenone (Rot) bar is the mean of 2 experiments. (C) Representative traces depicting RET-mediated H2O2 production by brain mitochondria incubated with succinate, followed by addition of CTRL or mdivi-1, and then ADP (2 mM). (D) Quantification of the data in (C) (mean ± SD, n=3). * p<0.05 compared to control.
