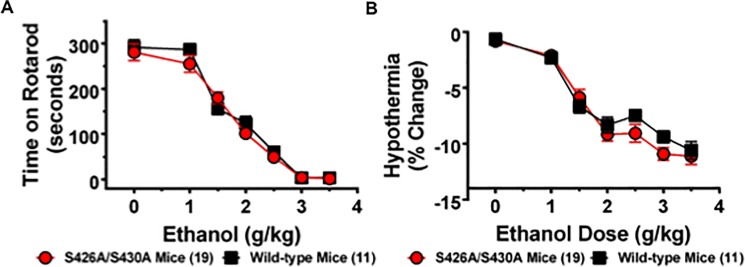
Fig 3. Sensitivity to ethanol is not altered for S426A/S430A mutants.
A. The ataxic effects of 0 (saline only), 1, 1.5, 2, 2.5, 3, and 3.5 g/kg of ethanol were measured in S426A/S430A mutants (red circles and line) and wild-type littermates (black lines and squares) using an accelerating rotarod. S426A/S430A mutant mice show the same sensitivity to the ataxic effects of ethanol as wild-type mice. B. S426A/S430A mutants also display the same sensitivity to the hypothermic effect of ethanol as wild-type mice. Error bars represent the SEM and data analyses were performed using two-way repeated measure ANOVAs with Bonferroni post-hoc tests. Sample sizes for each group are in parentheses.

