. 2016 Aug 16;5:e16695. doi: 10.7554/eLife.16695

Figure 2. hCRY2-A260T mice have advanced phase of sleep-wake behavior in a light-dark cycle and a shortened circadian period in constant darkness.

(A) Mouse movement was tracked by an infrared video camera in LD. The ratio of immobilization time to total daily immobilization time (upper panel) and the ratio of walking distance to total daily distance (bottom panel) were plotted every 10 min. Data are shown as means with SEM (n = 8 for hCRY2-WT and hCRY2-A260T). (B) Peak time of immobility was measured by fitting a quadratic function to data from ZT0 to 13. Representative examples of curve fitting for hCRY2-WT and hCRY2-A260T are shown here. Data are shown as means with SEM (n = 8 for hCRY2-WT and hCRY2-A260T, *p<0.05 by Student’s t-test). (C) Onset and offset of locomotor activity. Data are shown as means with SEM (n = 8 for hCRY2-WT and hCRY2-A260T). (D) Actograms of wheel-running activity for hCRY2-WT, hCRY2-A260T, and littermate transgene-negative mice. The blue shadows indicate periods when the lights were on. Red lines were fitted to activity onset using ClockLab analysis software. (E) Phase-shifts in response to a 30-min light exposure at ZT14 indicated by red arrows in (D). *p<0.05 by Tukey’s test (n = 7 for hCRY2-WT, n = 11 for hCRY2-A260T, n = 10 for WT). (F) The distribution of period measurements for BAC transgenic mice and transgene negative controls. Period was determined by line fitting of activity onset and chi-square periodogram from day 7 to day 19 in DD. *p<0.05 (n = 15 for hCRY2-WT, n = 14 for hCRY2-A260T and n = 7 for WT)

DOI: http://dx.doi.org/10.7554/eLife.16695.005

Figure 2.

Figure 2—figure supplement 1. Locomoter activity of h CRY2 BAC Tg mice.

Figure 2—figure supplement 1.

(A) CRY2 expression in total liver lysate at ZT18. CRY2 protein was detected by human CRY2 antibody (Santa Cruz) and mouse CRY2 antibody (Hirano et al., 2013). Copy number was determined by real-time PCR using common sequences in mouse and human Cry2 genes. (B) Representative profiles of locomotor activity measured by video recording. Activity onset (black) and offset (red) are indicated by arrows in the figures. The time of onset and offset for all animals of respective genotypes are averaged and plotted in Figure 2C. (C) Locomotor activity and resting behavior of transgenic mice on a mCry2 knockout background. Mouse movement was tracked by an infrared video camera in LD. The ratio of immobilization time to total daily immobilization time (upper panel) and the ratio of walking distance to total daily distance (bottom panel) were plotted every 10 min. Data are shown as means with SEM (n = 6 for hCRY2-WT/Cry2 KO, n = 6 for hCRY2-A260T/Cry2 KO). The average of activity offset and onset in LD 12:12 are shown (n = 6 for hCRY2-WT/Cry2 KO, n = 6 for hCRY2-A260T/Cry2 KO).
Figure 2—figure supplement 2. Wheel-running activity of hCRY2 BAC Tg mice.

Figure 2—figure supplement 2.

(A) Activity profiles of transgenic mice in LD 12:12. Ratio of wheel-running counts to total daily counts are plotted every 20 min (n = 18 for hCRY2-WT, n = 14 for hCRY2-A260T). The average of activity offset in LD 12:12 are shown in the right graph. *p<0.05 by Tukey’s test (n = 19 for hCRY2-WT, n = 19 for hCRY2-A260T and n = 7 for WT). (B) Actograms and activity profiles of transgenic mice on a mCry2 knockout background in LD 12:12. Ratio of wheel-running counts to total daily counts are plotted every 5 min (n = 5 for hCRY2-WT, n = 5 for hCRY2-A260T). The average of activity offset in LD 12:12 are shown in the right graph. *p<0.05 by Tukey’s test (n = 5 for hCRY2-WT/mCry2 KO, n = 5 for hCRY2-A260T/mCry2 KO and n = 6 for mCry2 KO).
Figure 2—figure supplement 3. Light phase-shift of hCRY2 BAC Tg mice at ZT22.

Figure 2—figure supplement 3.

(A) Phase-shift in response to 30-min light exposure at ZT22. Mice were exposed to a 30-min light pulse at ZT22 (indicated by red arrows) and released into DD after the light pulse. The blue shadows indicate periods when the lights were on. Red lines were fitted to activity onset using ClockLab analysis software. Phase-shift was determined by line-fitting to activity onset (n = 6 for hCRY2-WT, n = 7 for hCRY2-A260T and WT).
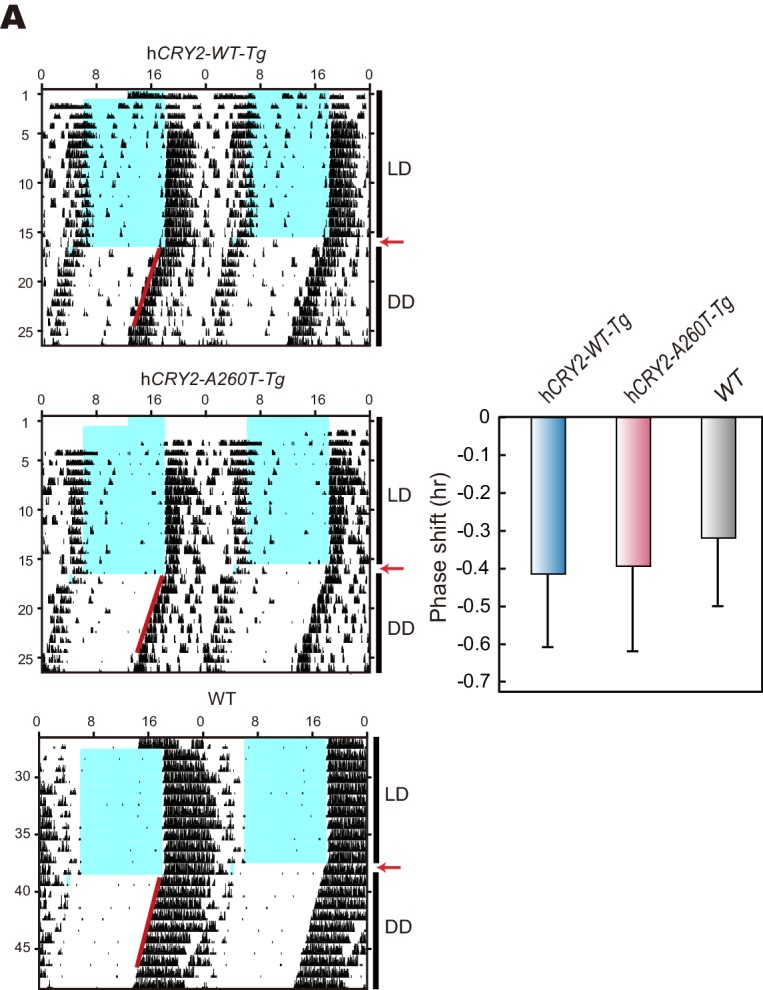
Figure 2—figure supplement 4. Wheel-running activity of hCRY2Cry2 BAC Tg mice on a m KO background and another BAC Tg mice line.

Figure 2—figure supplement 4.

(A) Circadian period of the transgenic mice on a mCry2 knockout background. Period was determined by chi-square periodgram from day 7 to day 14 in DD. *p<0.05 by Welch’s test (n = 6 for hCRY2-WT/mCry2KO and n = 5 for hCRY2-A260T/mCry2KO). (B) Circadian period and phase-shift of hCRY2-A260T mice line#2. Representative actograms of wheel-running activity of hCRY2-A260T line#2 and littermate controls (WT) are shown. The blue shadows indicate periods when the lights were on. Red lines were fitted to activity onset using ClockLab analysis software. Phase-shifts shown here are by 30-min light exposure at ZT14 (left panel, n = 7 for hCRY2-A260T line#2, n = 3 for WT). Period was determined by line fitting of activity onset from day 7 to day 19 in DD. *p<0.05 by Student’s t-test (right panel, n = 7 for hCRY2-A260T line#2, n = 3 for WT).