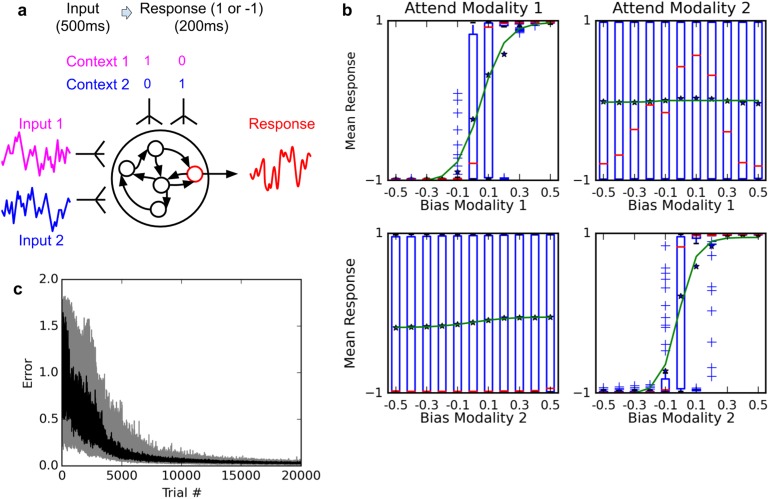
Figure 4. Selective integration task.
(A) (top left): task description. The network receives two noisy inputs, simulating sensory information coming from two different modalities, as well as two ‘context’ inputs to indicate which of the two sensory inputs must be attended. The task is to produce output 1 if the cued input has a positive mean, and −1 if the cued input has negative mean; this task requires both selective attention and temporal integration of the attended input. (B) (top right): Psychometric curves of network responses. Responses are segregated according to the value of the relevant modality bias, and shown as box-plots: blue boxes indicate the inter-quartile range, with data points outside the box showing as blue crosses; red bars indicate medians, and dark stars indicate means; green curves are sigmoid fits to the means. Top-left panel: Responses when context requires attending to modality 1, sorted by the bias of modality 1 inputs. The network response correctly tracks the overall bias of modality 1 inputs. Bottom-left panel: same data, but sorted by modality 2 bias. Network response is mostly unaffected by modality 2 bias, as expected since the network is required to attend to modality 1 only. Right panels: network responses when the context requires attending to modality 2. Again, the network correctly identifies the direction of the relevant modality while mostly ignoring the irrelevant modality. (C) (Bottom): Median and inter-quartile range of trial error (mean absolute difference between output and correct response over the last 200 ms of the trial) over 20 runs of 20000 trials each.

