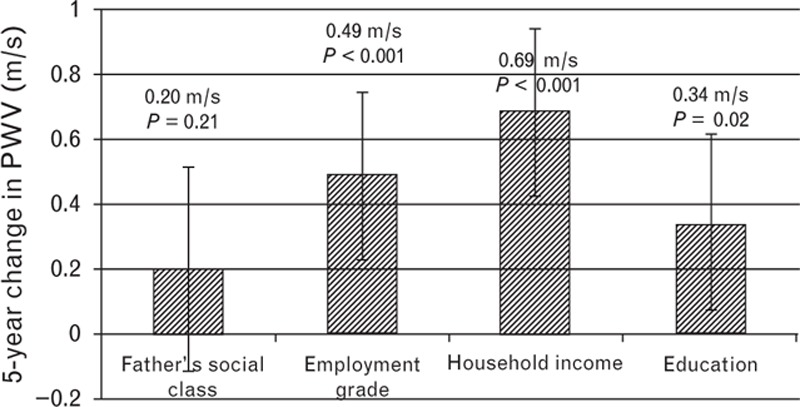
FIGURE 1.

Slope index of inequality for 5-year change in aortic pulse wave velocity. Slope index comparing the lowest SES with the highest SES adjusted for age, sex, ethnicity, and mean arterial pressure. Bars show 95% confidence intervals. SES, socioeconomic status.
