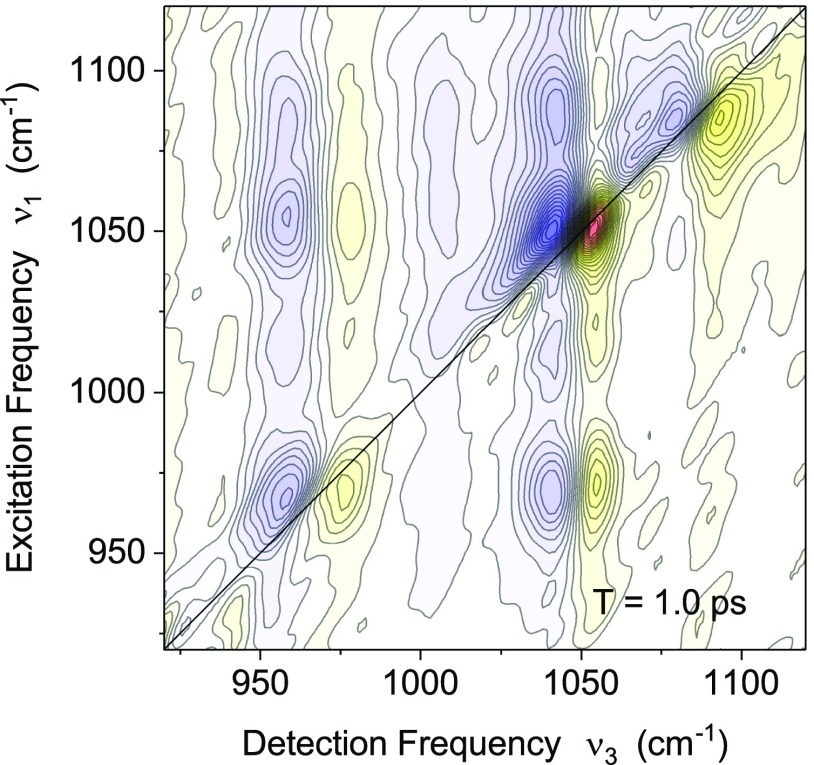
FIG. 4.
Two-dimensional infrared spectrum of backbone modes of salmon testes DNA in aqueous solution. The absorptive 2D signal is plotted as a function of the excitation frequency ν1 and the detection frequency ν3. Red yellow contours are positive signals and blue contours represent negative signals. The signal changes by 5% between adjacent contour lines. The diagonal peaks () represent the response of the individual backbone modes with positive signals from their v = 0 to 1 and negative signals from the v = 1 to 2 transitions. The lineshapes of the positive diagonal peaks were used to extract frequency fluctuation correlation functions.32 The cross peaks are due to intermode couplings and population transfer between the modes.

